BUSINESS REPORTING SOFTWARE - COMMUNICATE DATA EFFiCIENTLY
Create beautiful dashboards to share with your colleagues or customers
Your data is valuable. With our best-in-class business reporting software, we provide you an easy way to visualise and communicate insights throughout your entire organisation. Having one centralised and accessible platform for your most important KPIs will create a data-driven culture, keep all key personnel informed and help you and your team to grow your business even faster.
VISUALISE AND REPORT YOUR INSIGHTS
CREATE MEANINGFUL VISUALS AND SHARE THEM WITH YOUR TEAM, CUSTOMERS OR OTHER SHAREHOLDERS,
WITHOUT INVOLVING A DATA SCIENTIST
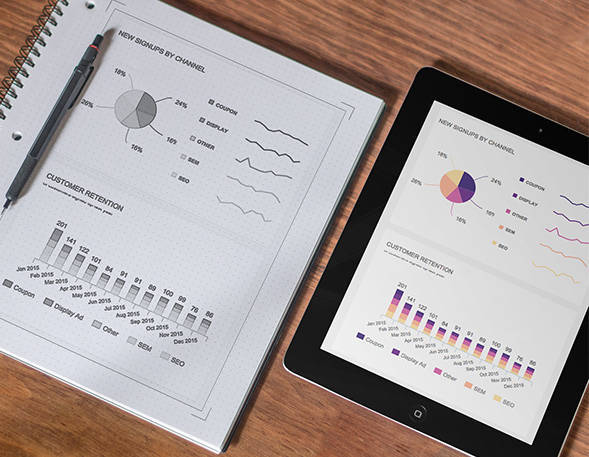
A business reporting software has one goal, to make data analysis and reporting an easy and less time-consuming task. Business reporting is an essential business activity that alleviates work for business users and especially decision-makers.
Its visual nature helps in understanding quickly complex issues and removes the guesswork, while letting you glean valuable findings from your data. Business reporting tools make it easy to turn raw data into actionable insights thanks to an all-in-one overview of the current situation. Such big picture is an advantage that makes room for a quicker and better-informed decision-making.
Crawling through spreadsheets to find the figures you need is a pain. For smaller teams, this can block an inordinate amount of resources. We want you to skip the difficult task of extracting data from mazes of data sources and make you independent in handling your data. You no longer need to rely on your IT team and can access millions of rows of data by yourself, beautifully visualised in meaningful charts and tables.
Connecting your data source is a quick process. It takes minutes instead of weeks to sync to your central repository. From here, you can build charts using our intuitive drag-and-drop navigation and create live reports from your findings, having them at your disposal whenever you or your team needs them. Business dashboards are an incredibly useful reporting tool that comes in handy when anyone needs to make decisions based on solid information backed up with data. Modern dashboards are the essential information tools that help you manage the hundreds of vital parts of your business. Like a dashboard in a car, they report in real-time on the state of your operations with an at-a-glance overview painting a comprehensive picture of your business performance.
The mind-numbing task of manually creating daily or weekly reports is something you can avoid by using the right business reporting software. Instead, give your team access to mind-blowing interactive dashboards. They’re in real-time and there is no more need for manual, time-consuming updates.
| platform component | platform feature | description & benefits |
|---|---|---|
|
Report
|
Share via Link
|
Recipients can simply access the dashboard via a generated URL. The link can be password-protected.
|
|
Report
|
Share in Viewer Platform
|
Share dashboards with viewers on a separate platform, where they can use individually assigned filters.
|
|
Report
|
Embedded Dashboards
|
Embed our dashboards via an Iframe in other business applications, external portals or websites.
|
|
Report
|
Mobile App
|
We offer a standalone mobile app for Android and iOS, where you can access your mobile dashboards.
|
|
Report
|
Standard Email Report
|
A standard report sends the same information to all recipients. This report is used by most of our clients.
|
|
Report
|
Customised Email Report
|
A customised report sends your dashboard to a group of recipients, each with recipient-specific content.
|
|
Report
|
User Role Management
|
datapine has 4 user roles to meet your individual requirements: admin, editor, viewer and power viewer.
|
|
Report
|
User-Specific Filters
|
User-specific filters will change the data of the shared dashboard individually for every recipient.
|
|
Report
|
Ad-hoc Reports
|
Thanks to easy-to-use BI features business users can create ad-hoc reports with just a few clicks.
|
|
Report
|
Automated Reports
|
We offer all the functions to automate your reports with ease, from advanced scheduling to filter options.
|
|
Report
|
Report Format
|
You can select to send the dashboard to the recipients in these formats: XLS, CSV, PDF or PNG.
|
|
Report
|
Report Text Options
|
You can add to every report an individual subject and a message, to customise your automated Email reports.
|
|
Report
|
Content Scope
|
You can flexibly choose to share a whole dashboard or just single selected dashboard tabs.
|
|
Report
|
Content Timeframe
|
Define for which timeframe (e. g. yesterday, last week) the dashboard should be filtered for the report.
|
|
Report
|
Global / Drillthrough Filter
|
Global filters will affect the data on the dashboard report for every recipient in the same way.
|
|
Report
|
Schedule Options
|
Choose between different report intervals (e.g. daily, weekly, monthly) & schedule the exact sending times.
|
|
Report
|
White Label Options
|
datapine offers a wide range of white label options for your individual reporting needs (client reporting etc.).
|
|
Report
|
Gapless Report Management
|
Once you set up a report you can easily edit, duplicate, deactivate or delete it with a few clicks.
|
4 DIFFERENT ROLES FOR HIGH ENTERPRISE SECURITY LEVEL
The immense amount of information that a business reporting software is collecting needs proper safeguarding of the system and the managed data. datapine’s high enterprise security level helps you control and assign specific roles for each user you collaborate with, ensuring you have the utmost protection and options to manage sensitive information effectively. That said, we offer 4 different roles that accommodate any business scenario:

- Administrator account without any limitations
- Can add other editors, viewers, and power viewers
- Full access to all modules and software features

- Limited to interactive dashboard access
- Can interact (filter/drill down etc.) with dashboards
- Cannot edit dashboards or charts

- Limited access to modules and software features
- Access only to shared dashboards & can edit them
- Cannot add, edit & delete databases

- Limited to interactive dashboard access
- access to a chart library assigned by admin or editor
- Can edit dashboards based on existing charts
The security and integrity of your data are extremely important to you, and to datapine. Permissions determine in what way your information will be viewed and interacted with by specific users. As there are different business scenarios where you might need different permission capabilities, datapine has created 4 types of users that can manage, interact, edit, and explore your analyses, dashboards, data sources, and reports, among other options within the software. These 4 roles enable companies to establish different security levels and roles that can create dashboards, add other users, or simply explore the dashboards based on assigned filters. Depending on the specific role, your business information will be safe at all times, and you will be able to have complete control over what is shared, with whom, and with what kind of permissions. That way, you will have complete supervision of your most sensitive information.
The permitted actions that you assign to each role are designed to increase the protection of your analyses and give you multiple choices about the data and information you might want to share. The admin level is the highest role a user can have, followed by the editor, power viewer, and viewer. Each of these roles has its specifics and possibilities to interact with our tool, which you can see in our overview above. datapine is built to keep our users in mind, and with every role that we have on offer, your information will be safeguarded in the most effective way.
Calculate your savings with datapine
Often the immense value of a solution such as datapine is difficult to quantify and communicate. For that reason we want to provide you with an easy calculator to help you getting a better idea of how much money you can save with a small monthly investment in our business reporting software.
The benefits of business intelligence are typically challenging to identify in a tangible way. We usually know how much it costs to invest, but the Return on Investment (ROI) is hardly ever fully measured – especially because it does not only bring raw financial benefits, but a lot of diffused changes and improvements in operational efficiency, customer service, communication within and between teams, regulatory compliance, profits, etc. However, if it isn’t easy to measure these improvements, it is easy to evaluate the costs incurred by not having a BI solution: data discrepancy, no central data access, IT personnel overload with small, low added-value repetitive tasks, synchronisation nightmare and time wasted over communication issues, static Excel sheets and trite, 100-slide PowerPoint presentations... and so on. Not having a modern business reporting solution is actually very expensive in the long-run.
As it is hard to estimate the advantages BI brings, we tried to find a way to somehow assign a monetary value to the benefits of BI in a simple, dashboard-focused way. With this calculator, you can simulate the savings you will make thanks to datapine’s business reporting tool in the analysis and visualisation of your data. Just enter the number of clients or departments that will benefit from it, how many dashboards created for each of them, the average amount of time spent on a dashboard per month, and the hourly wage of the employee working on them... And you will have an idea of the immense costs you can save yearly.
Try our professional business reporting software 14 days for free!
Snapshots of your progress
ACCESS THE LATEST REPORT OF YOUR DATA WHEREVER YOU ARE
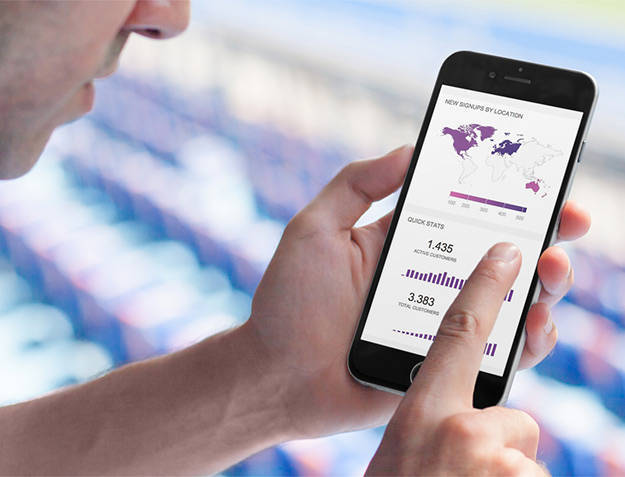
Our dashboards let you work on real-time data, which keeps you updated on anything that happens in your business. The web-base nature of our business reporting solution makes it easy for you and anyone in your team to access and work on dashboards conjointly, wherever you happen to be in the world. This is particularly convenient for interdisciplinary projects, and teams that are spread all over the planet but still need to collaborate. It's the best way to keep your key players on the same wavelength.
With datapine’s dashboard reporting software, you can choose the degree of interactivity you want to grant to your readers or collaborators: share simple read-only dashboards, or allow your entire team to use global filters so as to autonomously deep dive into different data sets. Sharing rich interactive reports is as easy as sending a URL. Your team can see your observations from your dashboard, but it’s nice to know they’ll receive it in their inbox too. Having access to the metrics that matter at any time enables you to make the right decision at the right time – something today’s globalised businesses ardently need.
Whether daily, weekly or monthly choose the frequency at which reports should be refreshed and sent out automatically to your recipients. All datapine reports are cross-device accessible and you can deliver all needed information via Excel, PDFs, and PNGs format. Be consistent in empowering your partners, customers and colleagues with expressive visuals on all relevant device categories.
BUSINESS REPORT EXAMPLES FOR EVERY USE CASE
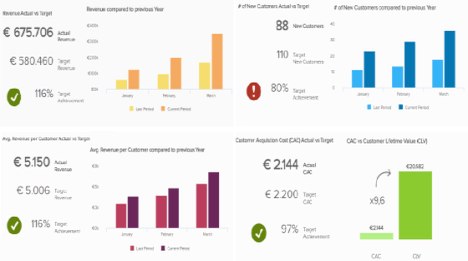
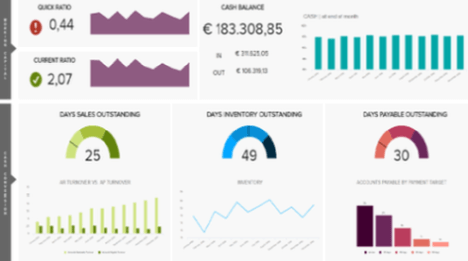
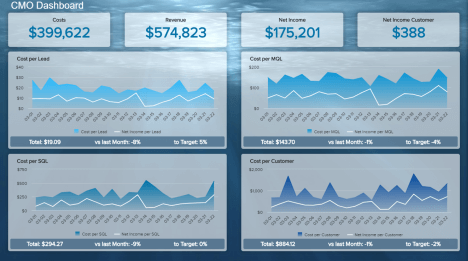
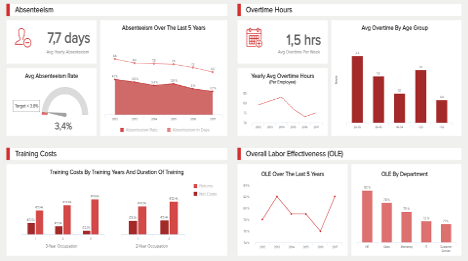
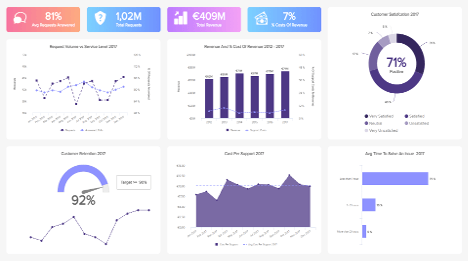
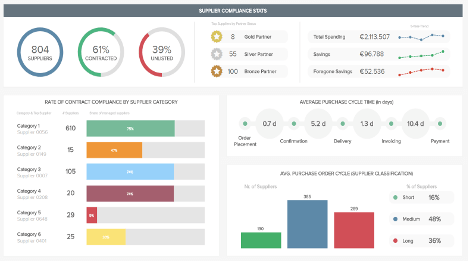
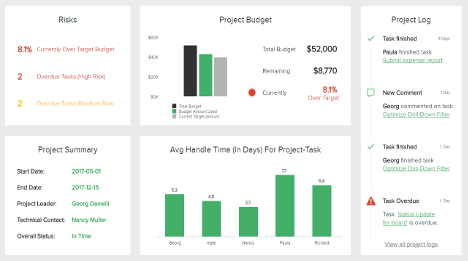
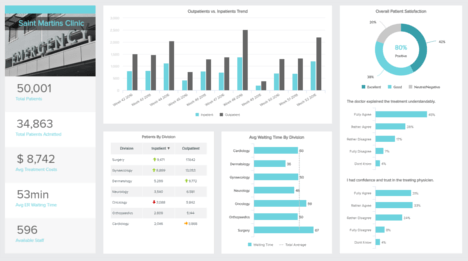
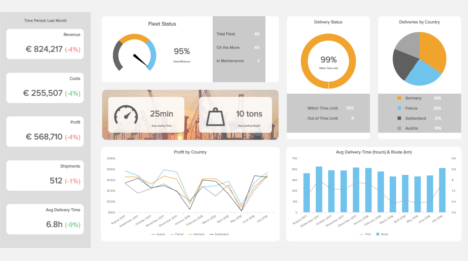
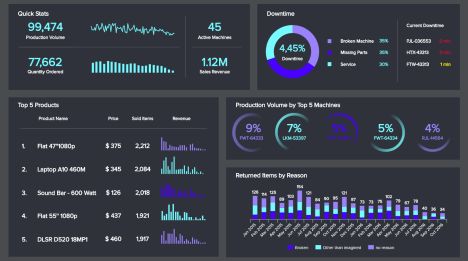
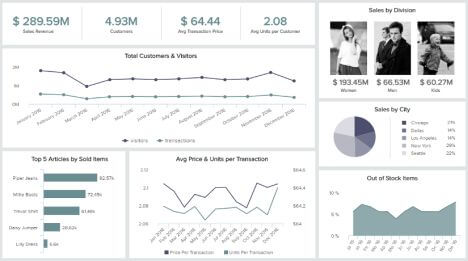
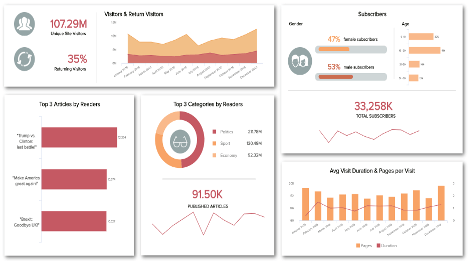
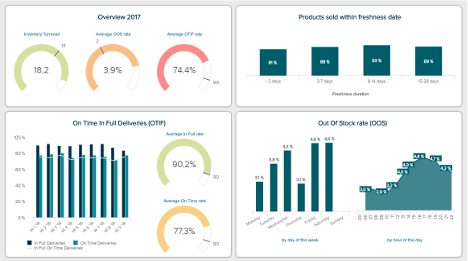
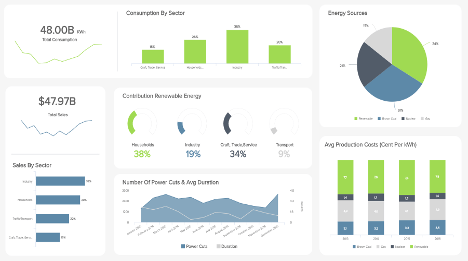
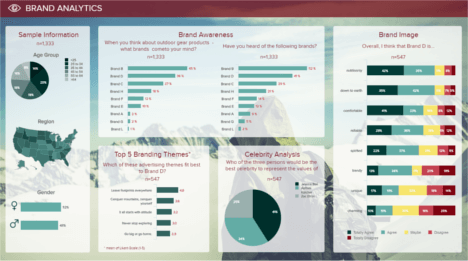
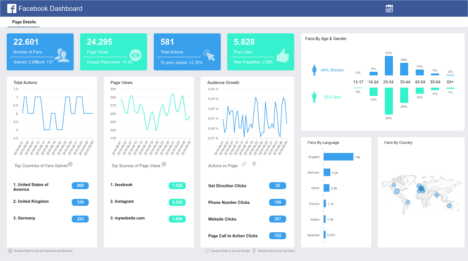
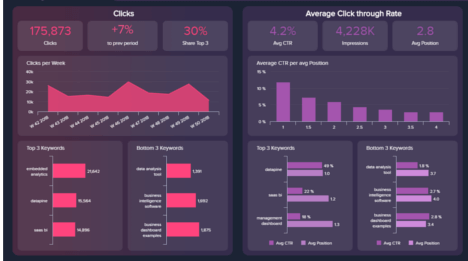
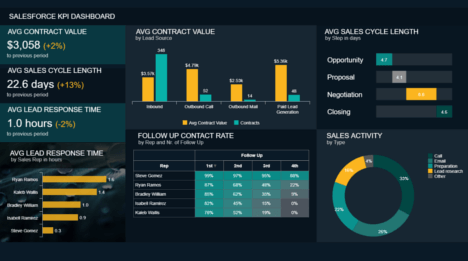
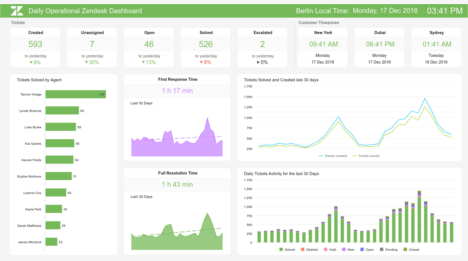
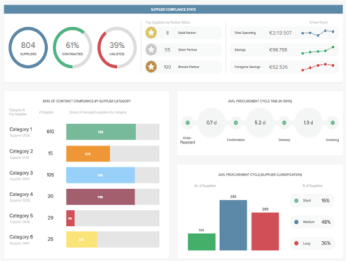
Dashboards are essential online reporting tools for your business reporting, in order to understand the insights gained from the analyses by simply visualising them. They offer a global view of the current status of activities in an easy-to-digest and meaningful way, enabling everyone to onboard the analytics train. Dashboards are easily shareable, which helps greatly in keeping everyone in the loop, and have the advantage of letting you work collaboratively. Dashboards provide you with information on how your business is doing over time, and on how your corporate activities are developing and how it can be improved. To give you an idea of what a dashboard made with datapine’s business reporting software looks like, we have created over 50 templates that you can find below. We handpicked specific KPIs relative to a business function (marketing, sales, finance etc.) or an industry (healthcare, logistics, retail etc.), that track the activity and operations that matter the most for each of them. Our dashboards are all interactive and have many different features that let you drill-down into specific data sets, zoom-in, or filter the entire dashboard according to certain criteria. Take your business reporting to the next level and forget about static Excel or PowerPoint reports!


