Twitter Dashboard Examples
A Twitter dashboard is a social media tool which helps Twitter channels to analyse performance, advertising efforts and important KPIs to determine the best strategy for posting relevant content, creating successful campaigns and engaging with the Twitter audience.
Let's take a look at these 3 Twitter dashboard examples: Tweet Performance Dashboard - Twitter Ads Dashboard - Twitter KPI Dashboard.
Tweet Performance Dashboard
Open Tweet Performance Dashboard in Fullscreen

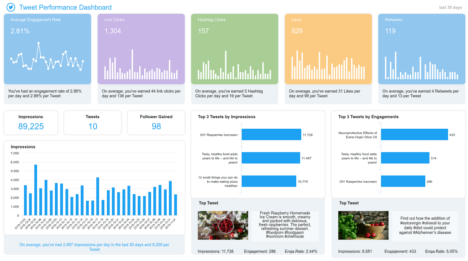
The fast-paced nature of Twitter is an advantage to build a strong online presence in no time. The problem comes when companies do not exactly know how to do it, or how to measure their success on the platform. Therefore, a Twitter performance dashboard is a key tool in understanding how your Tweets are received and get the most turnaround out of them.
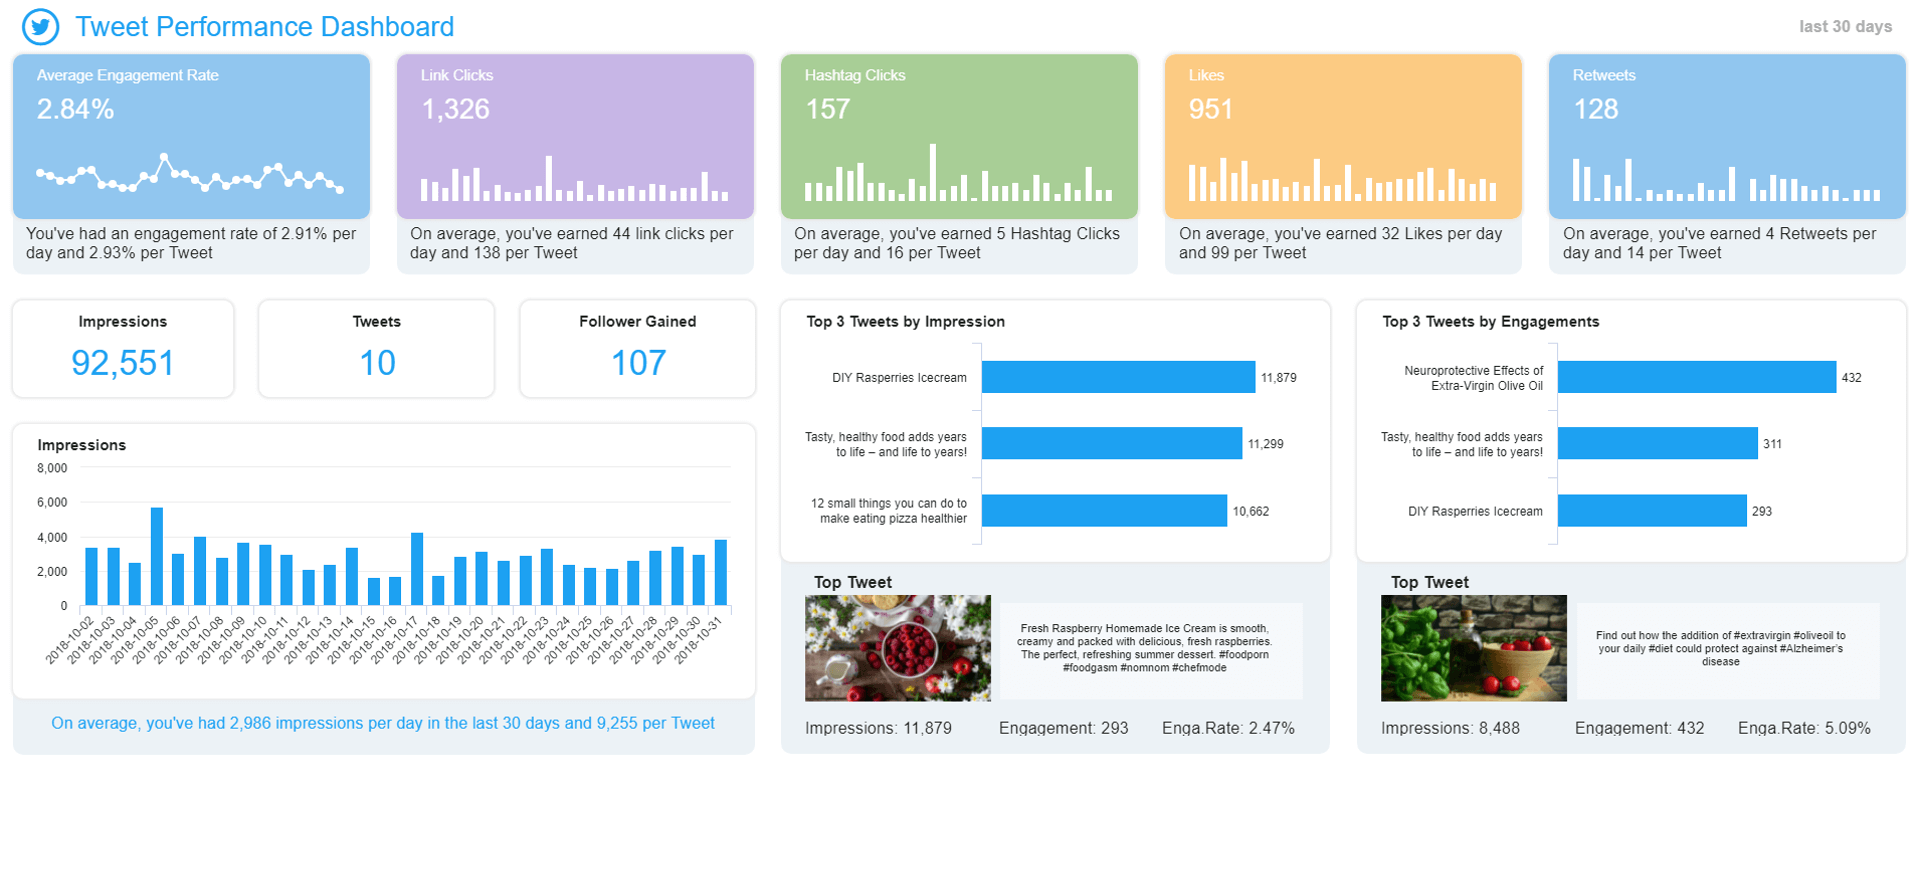
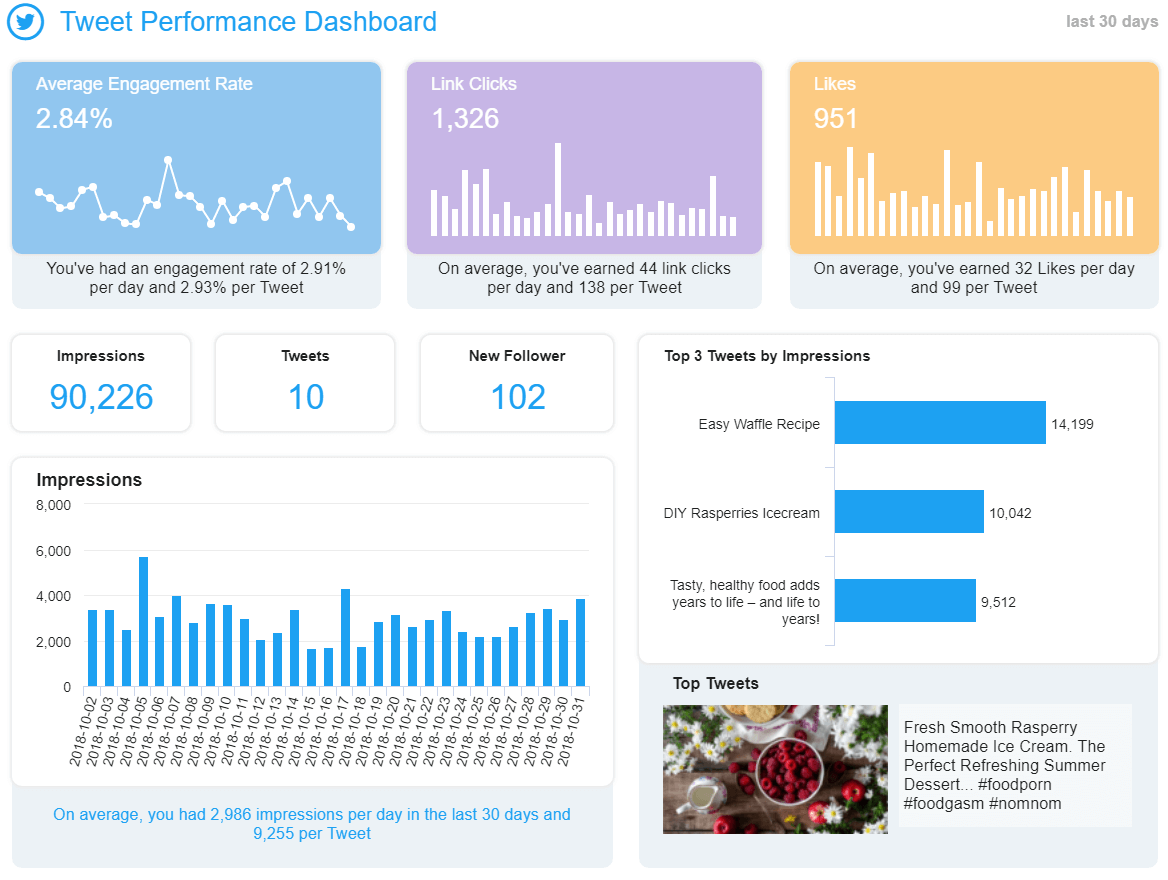
On our tweet performance dashboard, the top banner tracks three main metrics on your Tweets performance over the last 30 days: the Average Engagement Rate, the total Link Clicks, and Likes. The first one is the most important social media metric, as the number one goal of being active on these networks is to build connections with the audience and engage them. There are many ways to engage on Twitter, and the platform will look at various factors to calculate this ratio, namely: the number of clicks on a link, the number of time your brand is used in a hashtag, how many followers you have and how many people mark your page as favourite, how many replies you have on your posts, the number of backlinks towards your page, or the number of retweets.
Let’s move over to the bottom part of this dashboard. The evolution of Impressions is displayed over 30 days, with the average number per day and per Tweet. Likewise, the number of impressions cannot be taken alone: you may have 15k impressions but if you only get one like, you might want to rethink what you post (Engagement on social media is, after all, crucial). Analysing your top 3 Tweets by Impressions and Engagement is the best practice you should perform on a regular basis to understand what your audience is expecting and what they will be most reactive to. Going through the type of reaction your Tweets generate is also something to do – as you know, a like is great but a retweet or a comment is better, and shows more commitment from your audience. It shows that your readers really value your input and take the time to perform an action on their side (writing, or sharing to their own community of readers).
Evaluating the performance of your posts will help you in determining which content gets the most valuable responses and echoes the best. This is also how you can turn everyday followers into your brand advocates.
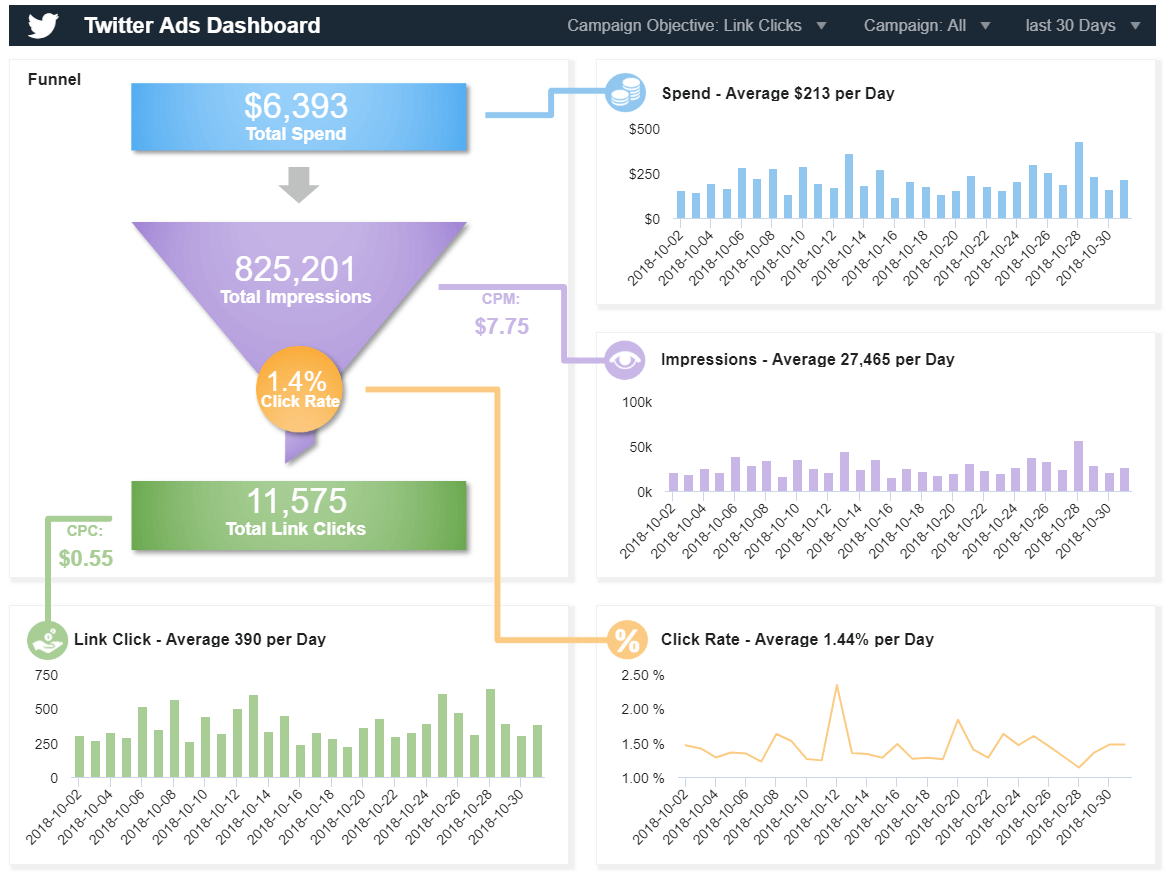
When you’re trying to develop your business, establishing specific objectives and tracking your results over a time-period is crucial. That’s where a Twitter Ads dashboard comes in: while you have all the important insights into one, interactive and clean overview, your advertising efforts can be significantly improved: reducing the time taking to generate a report, sharing your findings with other stakeholders or interested parties, and accessing your data in real-time will provide an efficient system that can increase revenue and decrease business costs.
The funnel represented on our Twitter Ads dashboard will guide you through important KPIs and metrics to follow: the total amount Spent, the total number of Impressions, Link Clicks, and the Click Rate. By segmenting these metrics into deeper elements, you will easily generate Average numbers gained per day. In our example, we have filtered the last 30 days, within the Link Clicks objective and All campaigns we have performed. The funnel then guides us over our most important metrics to follow and gives us a visual overview of what have we gained during this month. We can also see column charts that distribute the metrics’ numbers per day. That is an interesting feature to examine since you can visually see exactly which days were more successful, and which were by far the most unsuccessful. That way you can compare and investigate what preceded to cause this and implement those findings in your future campaigns. Another interesting thing you can find here is the lack of spreadsheets; the visuals provide you with an instant view of your all most important data in just one, interactive place. But it doesn’t end here: it would be wise to filter, the Top 5 Campaigns by CPC and Spent budget. Since our objective was established as Link Clicks campaigns, we need to examine the CPC and see if we can get more value by spending less budget. We can then examine the relations of the Click Rate, Link Clicks and CPC we have gained by different budgets, and use those findings for optimising current campaigns or how to repeat those results and implement them into your upcoming marketing efforts.
By establishing your goals and applying those insights to your future Tweets/Ads will make it easier to establish deep, long-lasting relationships with your audience, which is the most important part of your Twitter social media strategy.
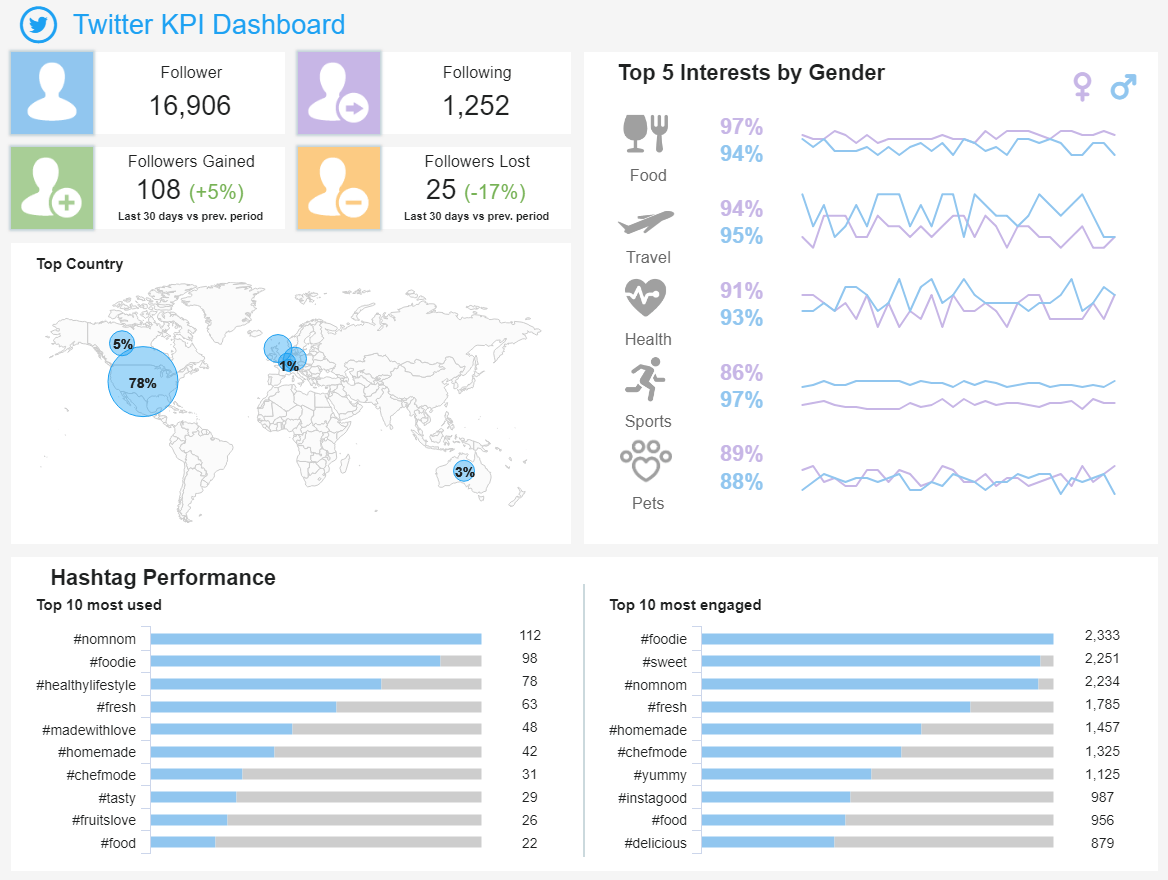
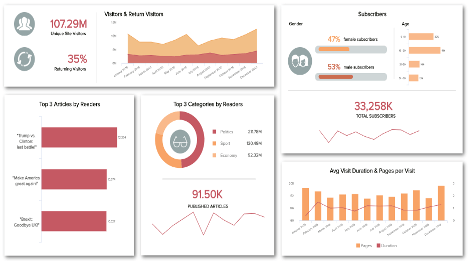
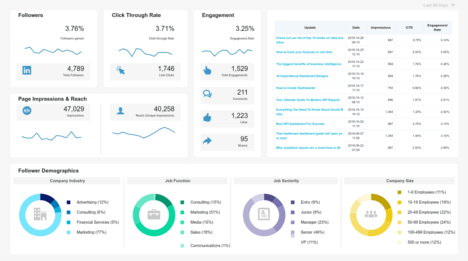
Our final Twitter KPI dashboard has a broader view on who your followers are and what they like. As already mentioned, success on Twitter is about getting social, so knowing your audience is key – the more you know about them, the better you can transform any interaction into a successful strategic action.
To do so, you need to track the right audience metrics, namely their demographics and interests. On this Twitter dashboard example, we see the total number of followers displayed, as well as the number gained over the past 30 days and the ratio of growth (or degrowth) compared to the previous period. Likewise, we see the number of lost followers and how much they represent in comparison to the number of lost followers of the previous period.
Below the Followers’ insights, you can see the origin or residency of your followers. This is an important metric to know, because that can determine how familiar they are with the language you write on, and hence cultural references. It also lets you know about the best times of the day for you to post: if your company is situated in Europe, but most of your followers are in North America as on this dashboard, posting during your office hours will not engage your audience that much. Thinking about scheduling some posts in the evening or night that they are more likely to see during their active hours is a better option. Likewise, knowing the interests of your audience will help you tailor your content better to fits their likings. Whether it is food, travel, health or sports, you should keep an eye on them as it might change as your business evolves.
Finally, studying the performance of your hashtags is a must on Twitter, as we all know that this is the very social media that has popularised this little typo, extensively and solely used in specific phone calls. By understanding what are your most used hashtags and the ones that received the most engagement, you know what echoes best in your audience and can ensure your next campaign is better customised to provide the highest levels of engagement.
Great marketing is, as most say, about saying the right things, at the right time to the right audience. Modern Twitter dashboards and analytics provide you with all the tools to figure out what you need to make insightful decisions for your future marketing campaigns. By combining hashtags performance with the rest of your Twitter insights on demographics or content performance, to visualise and analyse it all together on these professional Twitter dashboards: you have all the keys in hand for a killer campaign!

Setup only takes one minute. No credit card required!