Salesforce Dashboard examples
A Salesforce dashboard is designed to help the sales department monitor, analyse, and optimise all relevant aspects of customer relationship management which enables the sales team to make the most effective use of the available resources and achieve agreed sales goals.
Salesforce is a highly popular, cloud-based Customer Relationship Management (CRM) solution that provides tremendous value for planning and optimisation of sales processes. With datapine's all-in-one BI dashboard software, you can combine your existing Salesforce data with other data sources and utilise the full potential of your business information. A dynamic, interactive dashboard armed with powerful Salesforce KPIs will enable you to share your analysis results in a visually appealing and straightforward way throughout the company, and actively promote a data-driven sales or corporate culture. We will now take a detailed look into 4 examples that will illustrate the benefits of professional dashboards for interactive Salesforce reporting.
Let's take a look at these 4 professional Salesforce dashboard examples covering different sales application areas:
Salesforce KPI Dashboard - Salesforce Outbound Calls Dashboard - Salesforce Pipeline Dashboard - Salesforce Inbound Dashboard.
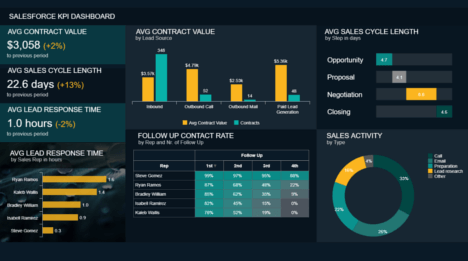
Salesforce KPI Dashboard
Open Salesforce KPI Dashboard in Fullscreen

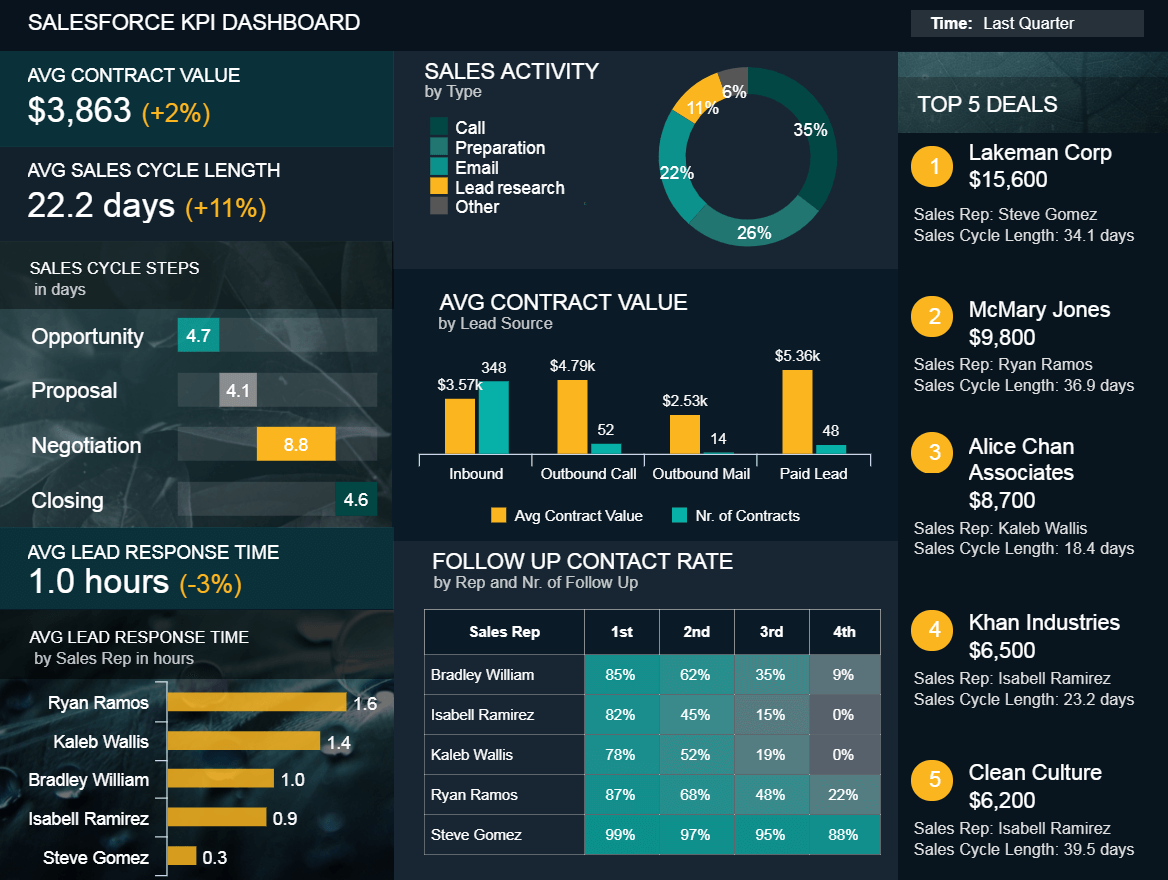
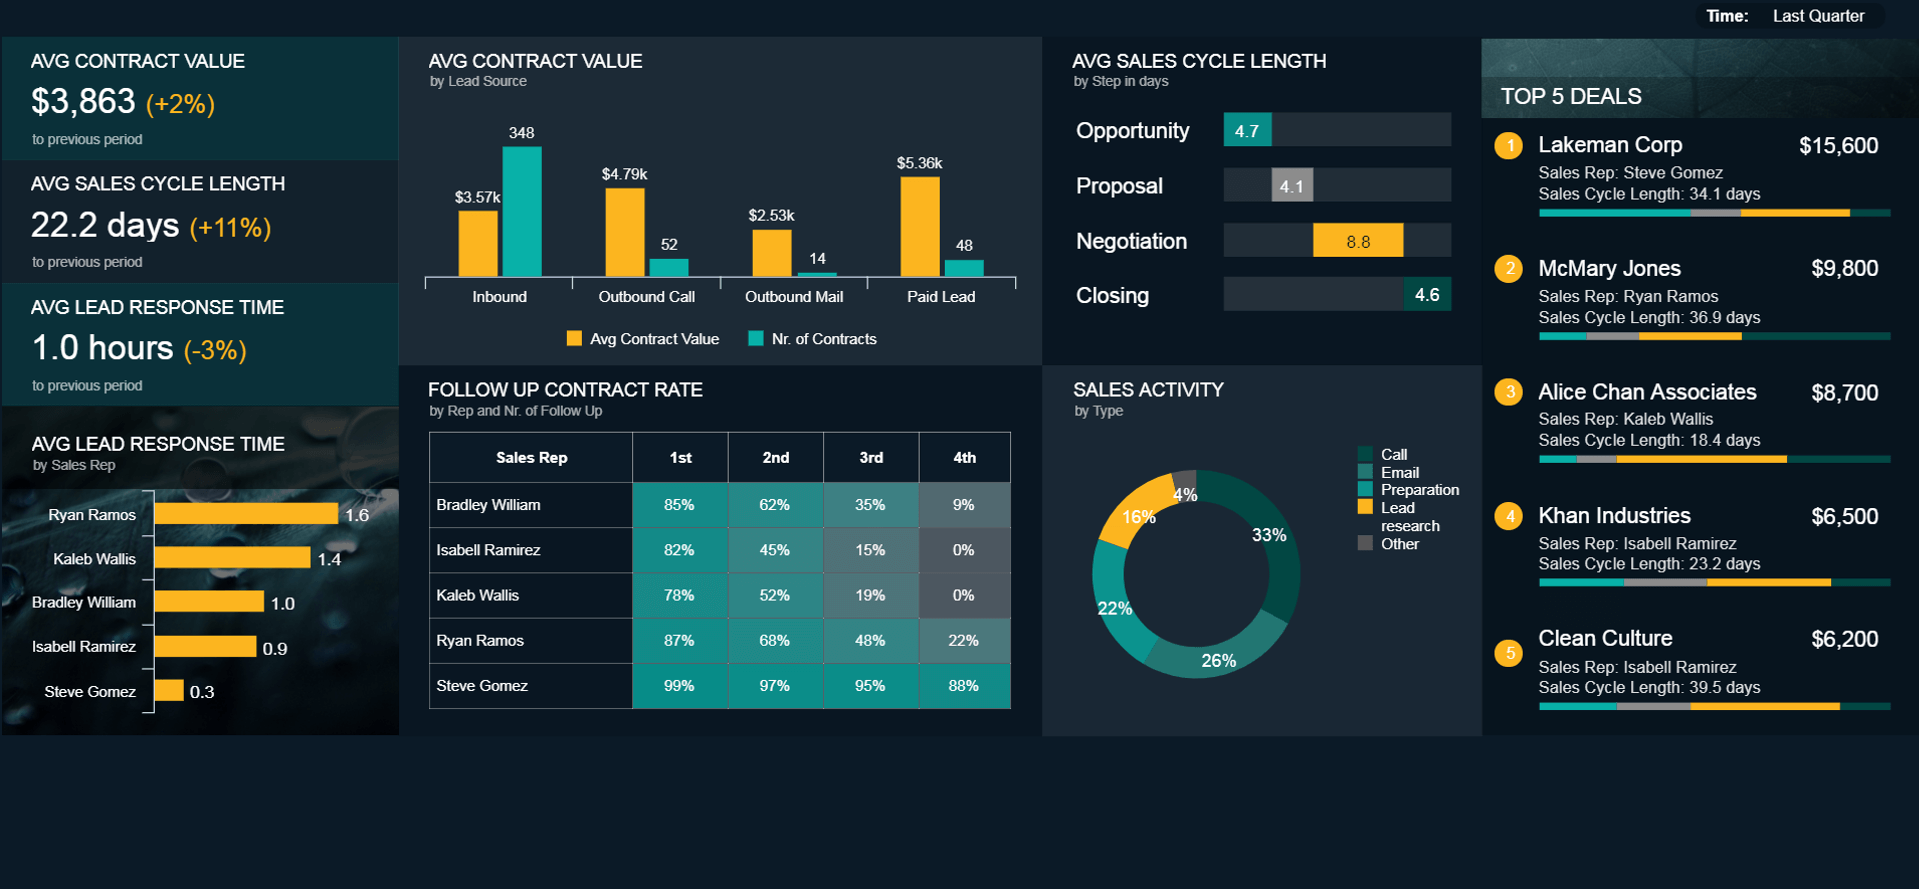
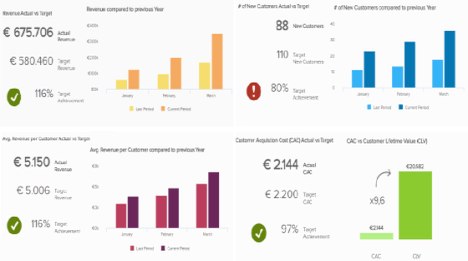
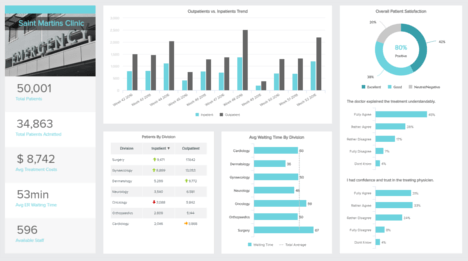
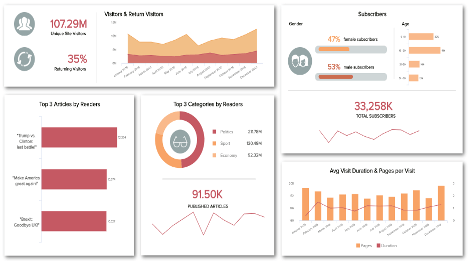
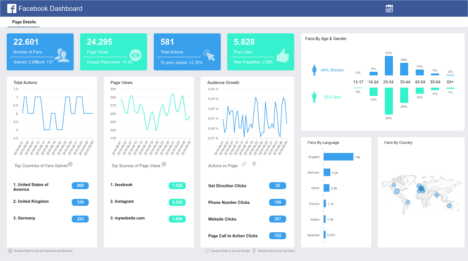
Our first Salesforce dashboard example – the Salesforce KPI dashboard - clearly summarises central Key Performance Indicators (KPIs) for evaluating sales performance. Among other things, the following KPIs are examined more closely: lead response time, follow-up contact rate, sales activities, as well as average order value and sales cycle length. Our sample dashboard looks at the figures from the last quarter and compares them with the previous quarter (please open the dashboard in full-screen mode to see all the details). The average order value and the number of deals are then analysed for different lead sources, as there are often significantly different, especially between inbound and outbound leads. In our example, most leads are generated with the help of Inbound marketing measures, whereas the highest average order value comes from paid leads from partner sites. It can be assumed, however, that paid leads usually also cause higher Customer Acquisition Costs (CAC).
Then, the sales cycle is scrutinised more closely. Of course, the sales cycle is very different for each product, but usually, it can be divided into 4 to 5 main phases. You can then analyse the average times for each phase to identify potential weaknesses in your cycle. Of course, thanks to the extensive filtering options of modern, interactive dashboards, you can view these values for individual employees or products with just a few clicks.
In addition, the bottom section of the Salesforce KPI dashboard provides details on average lead processing time for individual sales reps and follow-up contact rate. For example, if you and your team have agreed that new leads should be contacted within an hour, you can monitor this quickly and easily. Our example shows that Ryan Ramos has the highest lead response time, but also the highest follow-up rates. Here it should be examined whether this determination is really beneficial to the goal. For this reason, it might make sense to analyse all accounts which were closed after the third or even fourth contact attempt.
Last but not least, on the left side of the dashboard, you will find an overview of the 5 contracts with the highest order values in the last quarter. It is noticeable that 3 of the 5 deals had a significantly longer sales cycle. Whereas our first Salesforce dashboard example offers a high-level overview of the entire sales performance, our next dashboard looks at a specific sales area in detail: outbound calls.
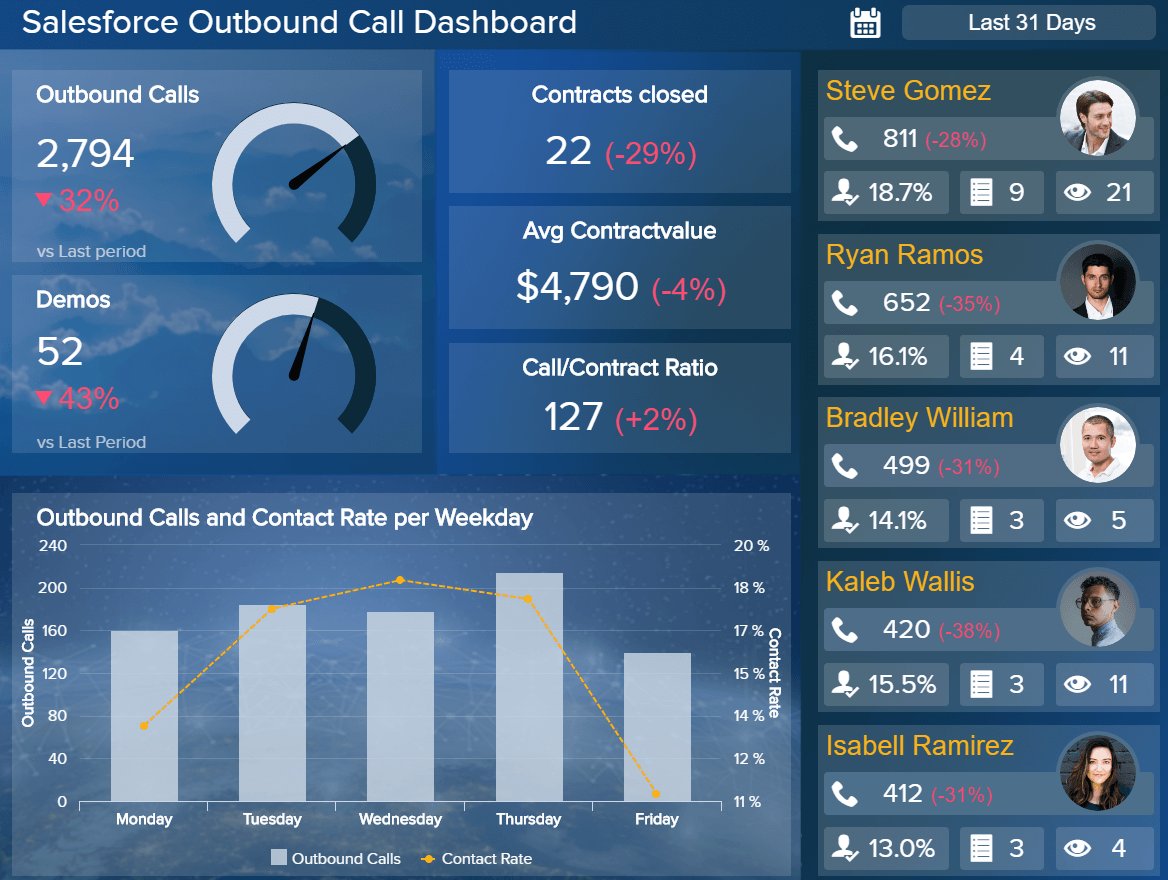
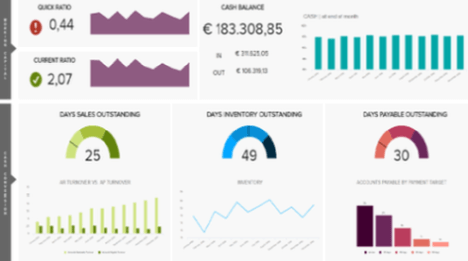
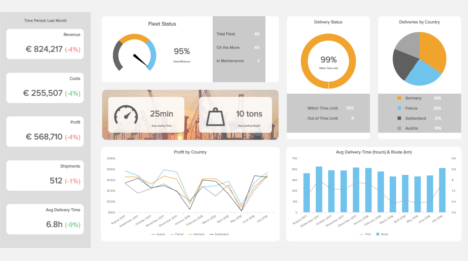
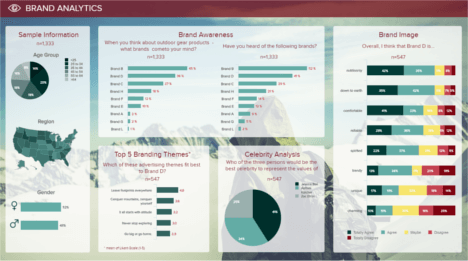
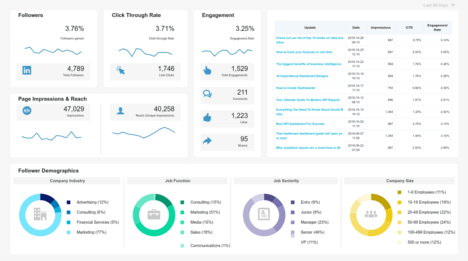
With the Salesforce Outbound Calls dashboard, we take a detailed look at key figures for telephone cold calling: the number of outbound calls, the outbound calls contact rate, the number of meetings or product demos agreed, as well as the number of contracts concluded and their average order value. The values on our dashboard example refer to the last 31 days for a 5-person sales team that spends about a third of its working time on cold calling.
To begin with, the aggregated number of outbound calls and agreed demos is visualised with the help of gauge charts. Here, the trends for the previous period are indicated, which are, unfortunately, negative. Especially in the B2B area you should analyse the contact rate for different weekdays and include the findings in future planning of outbound calls. As illustrated in our Salesforce dashboard template above, this is particularly peaked on Tuesday, Wednesday, and Thursday, which is not surprising in the B2B sector. It also demonstrates that the sales team could further reduce the number of calls on Monday and Friday. The bar chart at the bottom of the dashboard, which shows the number of calls made on a daily basis by each individual sales representative, will also provide additional benefits, and a detailed overview.
In the middle of the dashboard, you will find 3 number charts for the number of contracts closed, the average order value, and the ratio between calls made and contracts successfully completed. On the right, you'll also find a summary of the key metrics for each sales representative - the number of outbound calls made, the contact rate, the number of demos, and the number of contracts signed. Such an overview helps you to keep an eye on the performance of individual sales employees at all times, and to promptly react, and take appropriate measures in case of deviations from the targets.
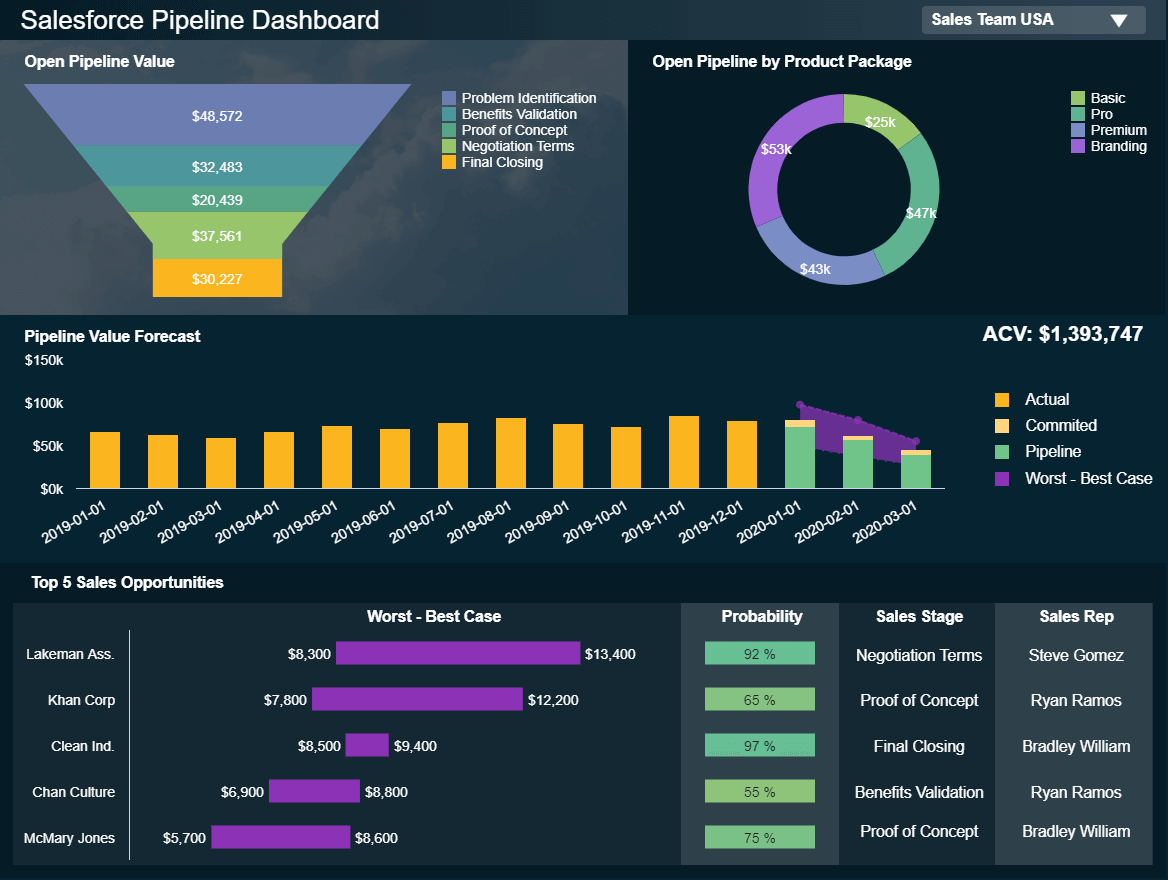
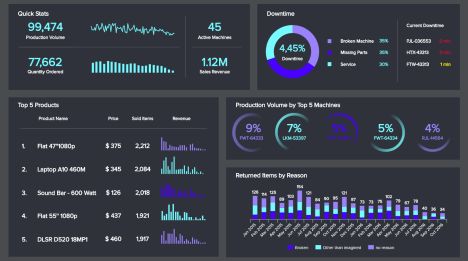
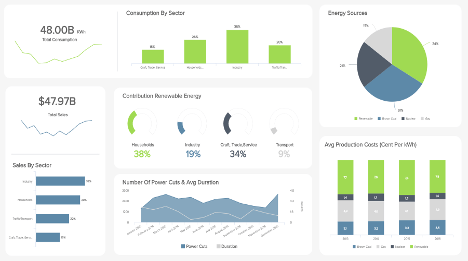
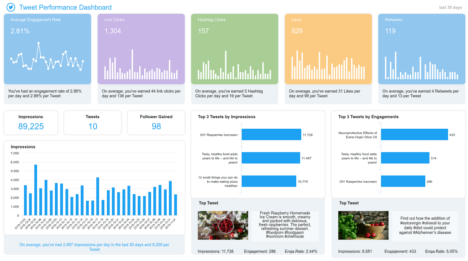
Our next example is the Salesforce pipeline dashboard and as it name suggests it aims to give a bigger picture into the actual value of your sales pipeline, this way you can understand how are your sales developing and how far are you from reaching your revenue goals. This specific pipeline dashboard includes a complex funnel that makes it ideal for B2B businesses, for example, in the SaaS market. Let’s look into it more in detail.
Starting with the most valuable tool for any sales department, the dashboard offers a visual overview of the open pipeline value. As we said before, this is a complex sales pipeline as it has several stages and it doesn’t show the number of potential clients on each stage but the monetary value of converting them. The open pipeline is then broken into the value of the different product packages offered by the company, meaning the value of the people interested on each package. This is valuable information as it lets you define on which stages and packages you should focus your resources since in sales you want to focus more on the deals you can close faster. Additionally, these metrics can tell you if your potential clients are getting stuck on one stage and dig deeper into the reasons.
Coming next is the pipeline value forecast which gives you useful information regarding the future of your sales. First, you get an overview of last year’s performance by month, based on this you get a prediction for the performance of the next three months divided into your committed deals, which can also include upgrades in the contract of past clients, your pipeline deals, and the worst- and best-case scenarios for each month to come. Within those predictions is also the expected ACV by month. This is important to track as the ACV will tell you how much revenue you can expect form your closed deals and plan strategies ahead. In the full screen version of the sales pipeline dashboard, you also get a chart about the forecast details of your sales representatives, this allows you to understand which of your sales managers is underperforming and find ways to improve their processes. The dashboard can also be filtered for the performance of one specific employee and provide it as a learning tool for each of your sales reps.
Finally, the pipeline dashboard includes a chart displaying the progress of your most profitable deals. The top 5 sales opportunities with their worst – and best- case scenarios are placed alongside a probability percentage that is influenced by the sales stage in which they are, as lower in the funnel, the higher they are to convert. By looking at all the KPIs offered by the Salesforce pipeline dashboard, sales team leads can improve sales processes, forecast future results, analyse the performance of sales strategies, and manage sales representatives in an efficient way in order to achieve the ultimate goal: revenue growth.
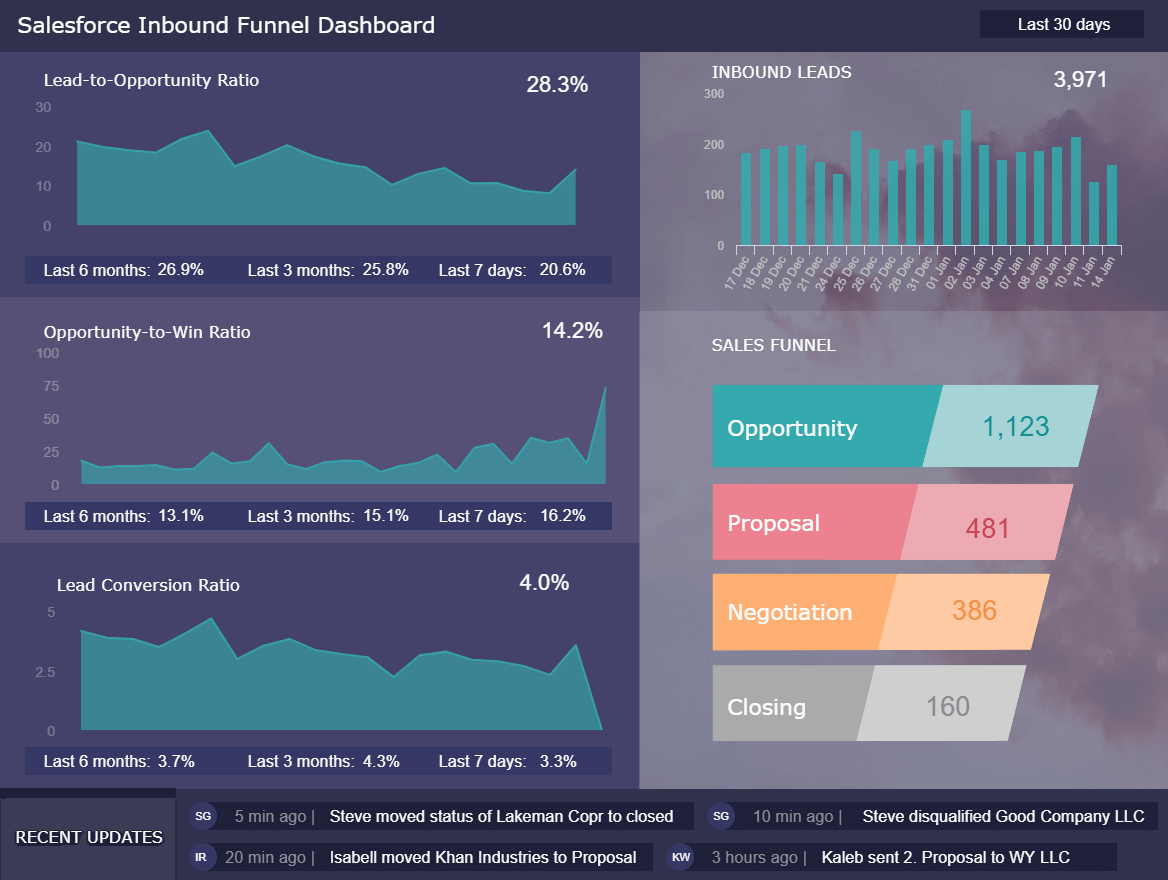
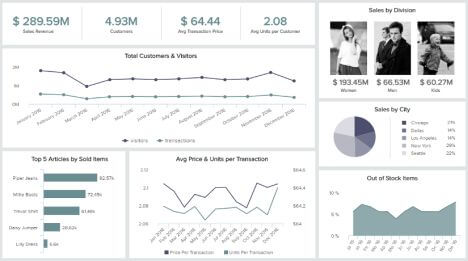
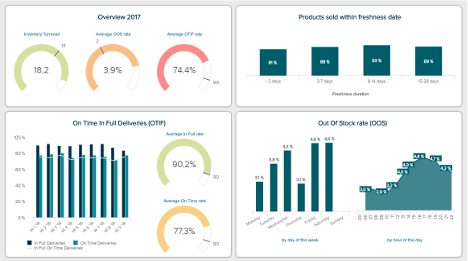
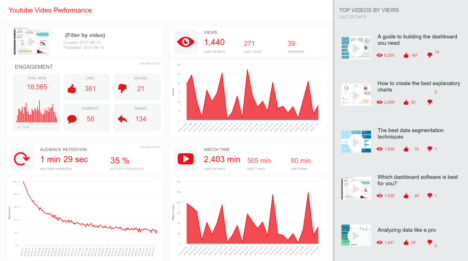
This Salesforce dashboard example focuses on inbound lead management and explains metrics to optimise your sales funnel: the lead-to-opportunity ratio, the opportunity-to-win ratio, and the lead conversion rate.
In business practice, getting the best possible lead qualification presents a major challenge for any company. The following dilemma often arises: either the inbound leads are overqualified – whereby potential customers may be neglected – or leads are insufficiently qualified, which then, due to a lack of prioritisation, wastes resources on leads of extremely low value. There are numerous approaches and methods available in this area, but a generally valid "success formula” for the lead qualification such as the BANT methodology, which is popular in the B2B sector, in reality, does not exist. Rather, you should develop an individual, optimal method for lead qualification through your very own tests and trial-and-error approach. This should be based on objective, measurable criteria in order to ensure the comparability of the results.
On the left side of our Salesforce Inbound dashboard, you'll find a detailed overview of the 3 metrics mentioned above to monitor and optimise your sales funnel over the last 30 days. The average lead-to-opportunity ratio is 29.6% and is slightly decreasing over time. This metric is often used to evaluate lead quality because it is calculated by dividing the ratio of qualified leads (opportunities) by the total number of leads received. In our example, this means that approximately 30% of all inbound leads received have been qualified using the selected lead qualification method. In business practice, a distinction is often also made between so-called MQLs (Marketing Qualified Leads) and SQLs (Sales Qualified Leads). The second key figure – the opportunity-to-win ratio – shows you how often a contract is concluded for a lead (SQL) which has been qualified by sales. This value is approximately 16.7% on our Salesforce dashboard template. This means that approximately every sixth SQL is successfully closed by the sales team. The lead conversion rate below shows you the effectiveness of the entire sales funnel, namely the percentage of all unqualified inbound leads that could be successfully converted into paying customers. Of course, you want to increase this key figure in the long term. However, with the help of the other two indicators already discussed, you can monitor the lead quality on the one hand, and the effectiveness of your lead qualification on the other. Of course, you can also analyse all 3 key figures also for individual sales employees if you have a sufficiently large sample size to get significant results.
We hope that with our 4 selected Salesforce dashboards we have been able to show you the benefits of a professional KPI dashboard software to monitor, visualise, analyse, and optimise your customer relationship management and sales performance. You are welcome to test our software completely free for 14 days and create your own dashboard with just a few clicks!

Setup only takes one minute. No credit card required!