Marketing Dashboard Examples
A marketing dashboard is a management tool that enables professionals to track, monitor, and communicate important marketing KPIs through data visualisation in order to identify and compare different measures and, ultimately, increase the overall marketing performance.
In today’s cutthroat age, marketing agencies and departments have the necessity to manage enormous amounts of data through spreadsheets and static reports that often cause clutter and loss of valuable information. With the help of online data analysis, you can easily create the best marketing dashboards that will allow you to bring all your marketing performance data into a single access point, enabling you to interact with each marketing metric and transform valuable insights into actions and results. It provides clarity to identify trends, acts as a focal point for all necessary marketing data, and ensures an easy-to-read display of key marketing metrics, whether on a daily, weekly or monthly basis, junior or c-level management. With the help of marketing analytics software, you will be able to maximise results and bring all your data in a clear and effective order.
We will now present 5 professional marketing dashboard examples covering different application areas and target groups:
CMO Dashboard - Marketing Performance Dashboard - Marketing KPI Dashboard - Web Analytics Dashboard - Social Media Dashboard
CMO Dashboard example

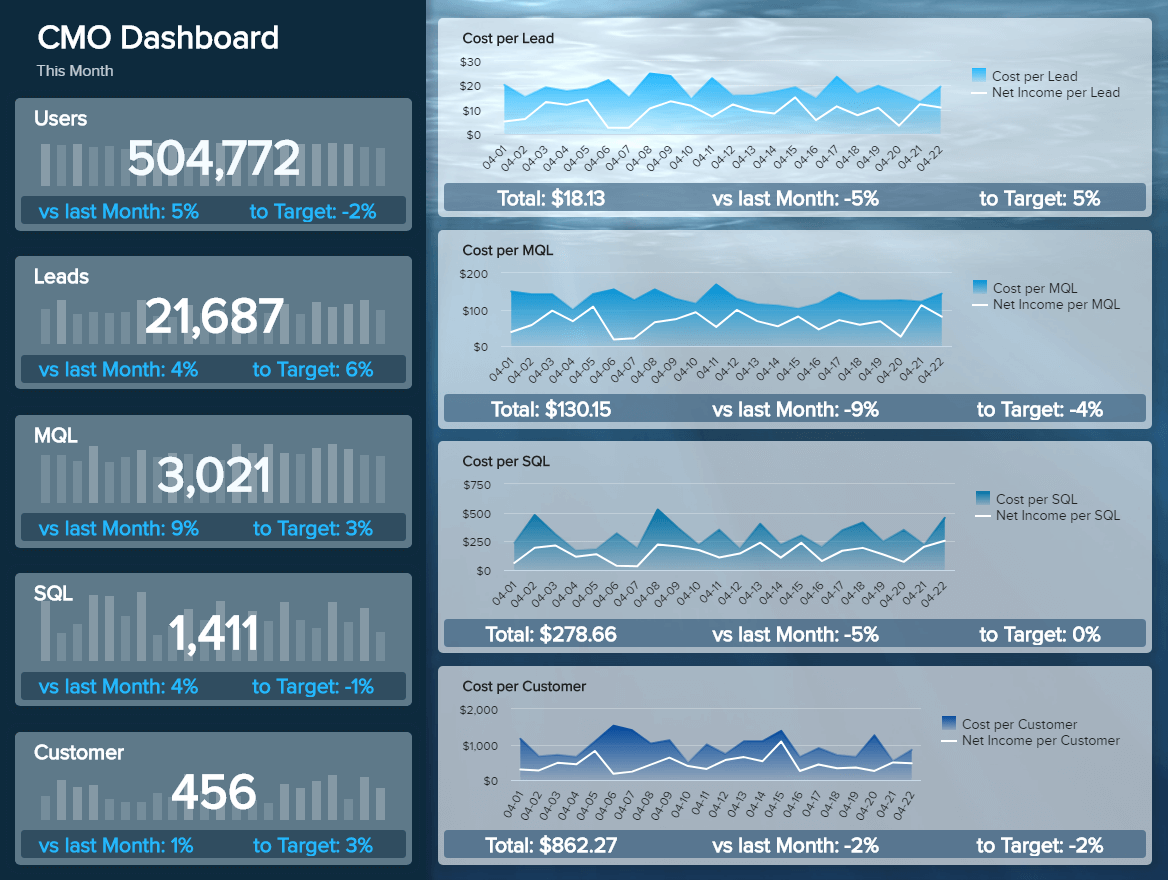
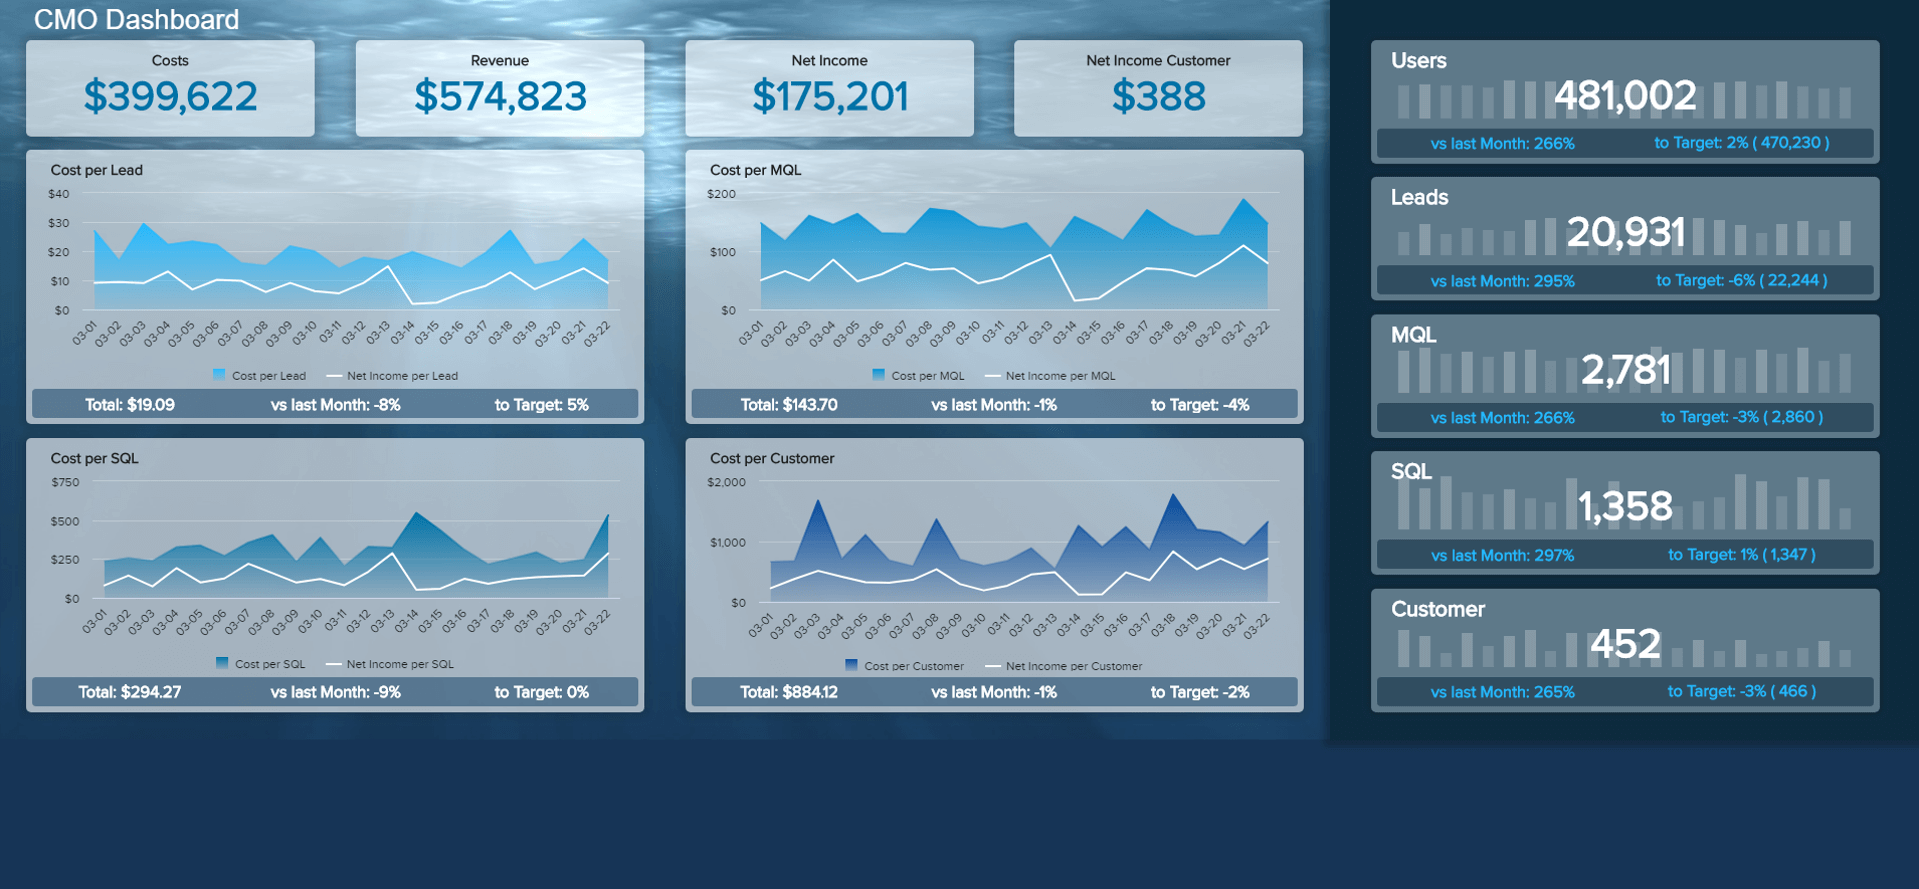
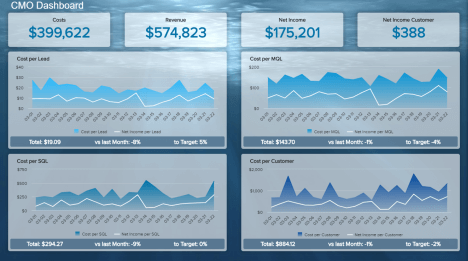
Our first marketing dashboard template emphasises the power of high-level metrics created for a Chief Marketing Officer (CMO). Marketing executives often don’t have time to research, looking into every detail or monitor low-level KPIs such as the CTR of a display campaign. They need to stay on top of the marketing insights needed to ensure stable progress. That’s where a CMO dashboard creates opportunities and we will explain this in detail.
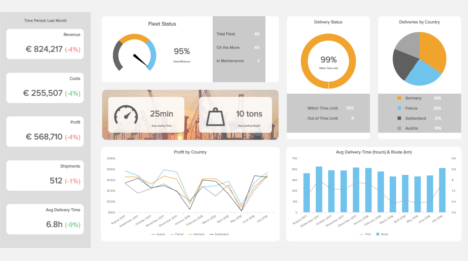
The CMO dashboard template we have created is designed to give marketing executives an overview if they will reach the goals of the current month. Please open the CMO dashboard in full-screen to see all details. On the top you see 4 number-charts showing the current revenue, costs, net income and net income per customer for the first 22 days of this month. Additionally, you get a detailed status of your marketing funnel by showing the current number of users, leads, MQLs (marketing qualified leads), SQLs (sales qualified leads) and customers. For every key performance indicator example, you can see the performance in comparison to the last month as well as to the set monthly goal. In this example, we have set a 10% increase in the number of leads as our target, but with the current performance, we will likely miss it by 6%. On the other hand, we can see, that our current performance is 4% better in comparison to the same period of the last month.
Afterwards, we depict these metrics into even more detail, expressing the costs and net income for the mentioned KPIs over time. Each metric shows us the comparison with the last month. We can see the total costs and a visual of each day showing the monthly trends in an area chart depicting also the net income.
This is one of the best marketing dashboards for c-level management that needs to monitor the strategic outcomes of high-level marketing metrics, control customer costs, and see whether their quality of generated leads is corresponding with their sales goals. By taking advantage of automated marketing reports and this professional CMO dashboard, companies and agencies can upscale their marketing performance with ease.
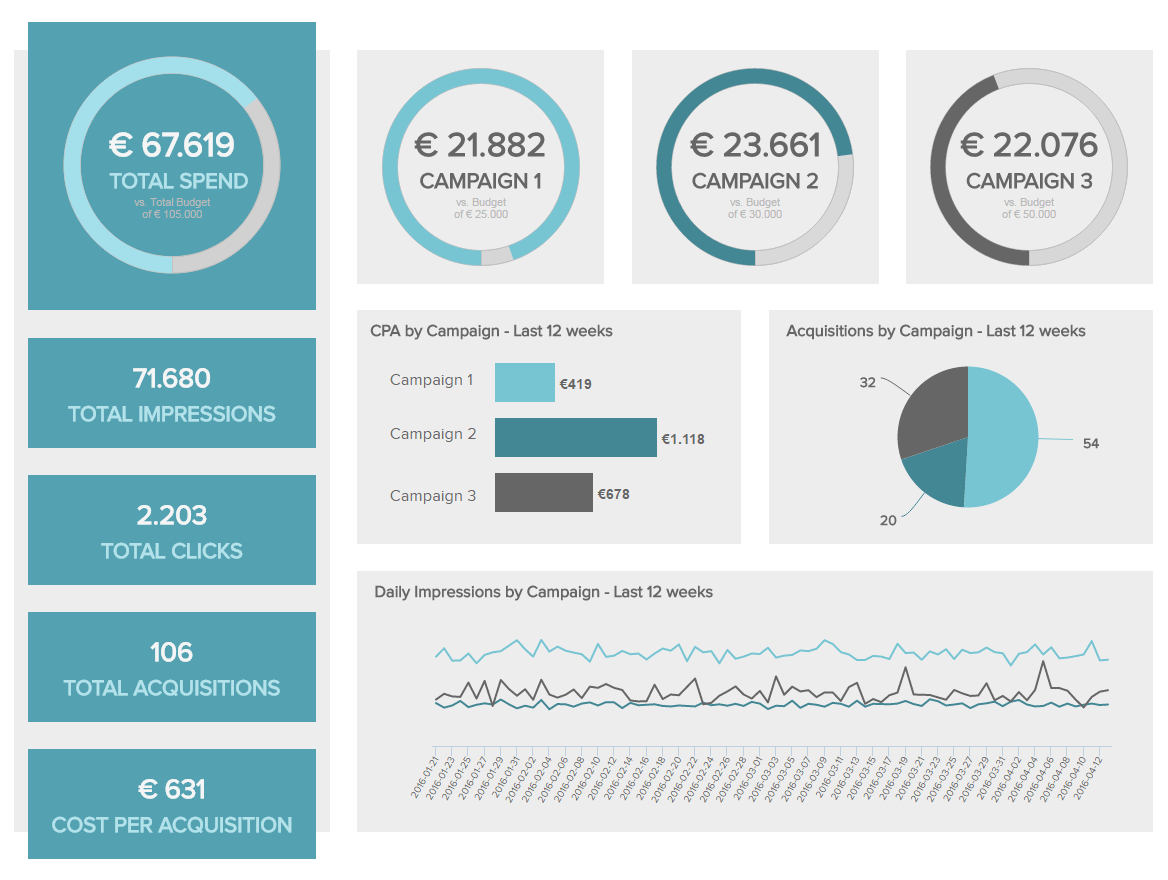
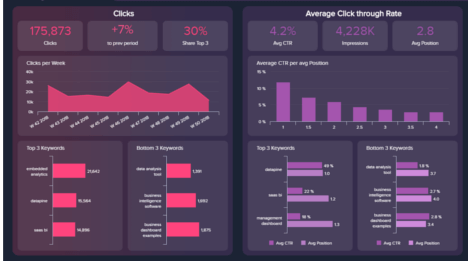
This marketing dashboard template provides a perfect overview of all your marketing performance data across all your different marketing channels and campaigns. The important question is: how much are we spending and what had we planned for this campaign? This is why our marketing reporting dashboard starts by measuring your total costs vs planned costs which compares if your costs goals are actually in line with what is feasible. At a glance, you can see if you are on target to meet your marketing budgets for every single campaign. The total number of impressions, clicks, acquisitions, and costs provide an even more detailed overview of your marketing performance data, enabling you to interact with each part of this marketing reporting dashboard and generate valuable insights. This makes planning and executing marketing goals much easier.
The marketing campaign performance dashboard then takes a look at the click-through rate (CTR) of your paid search campaigns. This is the connecting step between getting the customer to notice you and actually click on your advertisement. It makes sense to compare the CTRs for each campaign or ad group and track the rate for each country you are advertising in, even in similar countries you can see huge differences when it comes to what works and what doesn’t.
Next up on the dashboard we look at the cost per click or CPC, which can also be monitored by campaigns (please open the full-screen link to see all KPIs). This is also extremely useful for marketing and advertising agencies that handle multiple accounts and campaigns at once, and need to know where their dollars have been spent and what kind of results they’ve generated. It is crucial for business success to have actionable data in an easy to comprehend way. This is exactly what our marketing campaign dashboard focuses on.
Finally, the marketing performance dashboard looks at cost per acquisition (CPA) which is often considered the most important KPI in this dashboard. Having an answer to the question ‘How much are we spending for a new customer?’ depends on having this KPI presented to you in a simple and customisable way. You want to be able to take a look at CPA for each campaign or channel? No problem. Additionally, our marketing performance dashboard provides you with an overview of the overall CPA in the bottom left-hand corner. This marketing dashboard template shows all the data you need to strategically decide where to put your valuable marketing money to be able to maximise all your results.
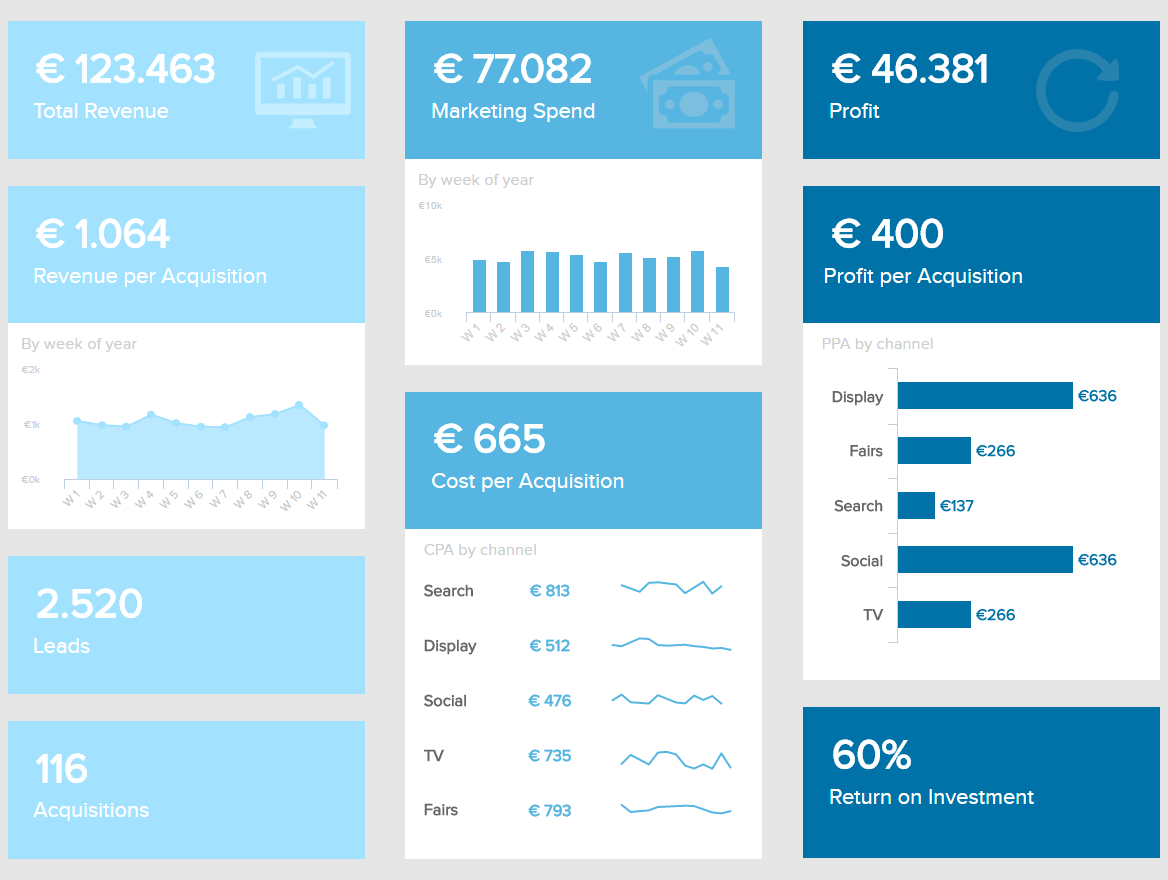
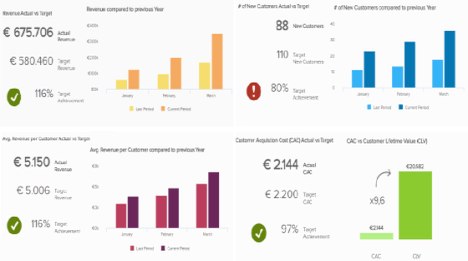
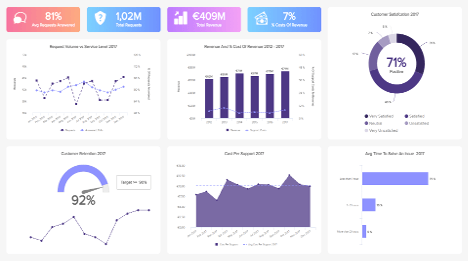
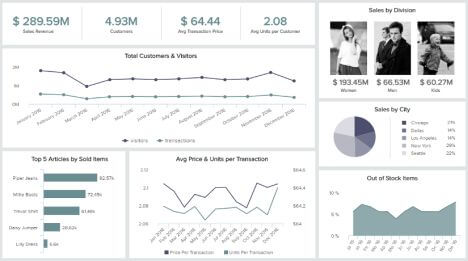
Our marketing KPI dashboard provides you with a quick overview of the most important marketing KPIs, which are of course cost and revenue stats. We know that these are the metrics that matter most to your bottom line and will, therefore, receive a lot of attention. This is the reason we designed this dashboard to be as clean and easily viewable as possible. Be aware though that while it is great to improve on the number of sessions and increase the CTR, these changes don’t always lead to more profit or a higher return on investment (ROI). So, while the marketing KPI dashboard provides a useful summary of cost and revenue stats, sometimes it can pay off to dig a little deeper.
You need to present the marketing results to your CEO or investors? This is where our marketing dashboard example excels. Typically, your CEO and investors are interested in the big picture, the bottom line and strategic decisions that advance the business. This is exactly what our marketing KPI dashboard does for you. It aggregates all the relevant cost and revenue statistics in one place, so you can easily relate the revenue to the marketing efforts from a single point of access.
The dashboard starts off by looking at costs per acquisition, which is the amount it costs to gain a new customer. Of course, you want to know which campaigns are acquiring the most customers at the lowest price, so it is useful to look at CPA across all campaigns and channels to see how you can bring on the most customers at the lowest cost possible. If you notice in your marketing campaign performance dashboard (our second example) that your social media efforts bring the lowest cost per acquisition, and the highest profit, it makes sense to invest more in your social media marketing, and see which tactics you can implement in other channels as well. These data can also be analysed by the week of the year, so you can easily spot if you have to adjust to seasonal peaks if your users perform desired actions in specific periods of the year.
We also aggregate the revenue and profit per acquisition to measure exactly how much money you are making per customer. Once again, these KPIs are the most useful when you compare different channels or campaigns to determine where your marketing dollars should go in the future. This is the kind of big-picture analysis that your CEO or investors are looking for, and this marketing reports dashboard will provide you with the necessary data and insights you need to outperform expectations.

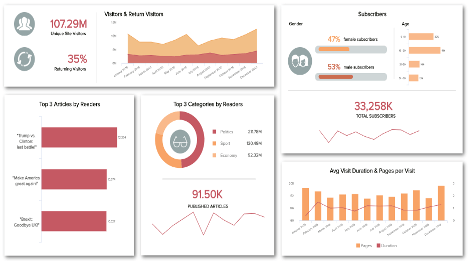
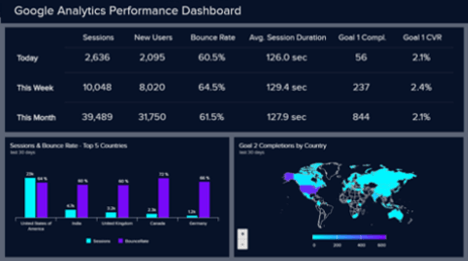
Many companies use Google Analytics (GA) as an easy and affordable way to track visitor behaviour on their company website. To gain a deeper understanding of your visitors, tracking is of course just the first step. A well-designed Google Analytics dashboard will give you an ideal overview of your all your major website KPIs.
The web analytics dashboard allows you to aggregate all tracking information so you can keep an eye on all major analytics with ease. The most basic information such as how many visitors you have over a period of time, and if they are new or returning can sometimes be the most important. This is why this data is highly visible and we made it easy to see at a glance if there have been any major changes. Monitoring your traffic sources probably is the second most used feature of web analytics, so we made it as easy as possible. In this marketing reports dashboard, you can easily see where your traffic is coming from and monitor if you are gaining more visitors by direct traffic, organic means, paid search, display advertisement, referrals or social media. By monitoring which traffic sources are working the best, you can tailor your time and budget accordingly.
But quantity is not everything. This is the reason our online marketing dashboard example also lets you dive in to track critical KPIs like bounce rate, average visitor session duration, and average pages per session. You want to dig deep and understand your visitors? These metrics enable you to qualify the quality of your traffic and draw conclusions from your data. For example, if your bounce rates are high it signals the dissatisfaction of the user, and lets you know that it is time to re-examine your content and your unique selling proposition (USP).
Ultimately, what you want are conversions. You want your visitors to take a defined action (=conversion), such as signing up for your newsletter, start a free trial or buy your product. We know how important it is to be able to monitor the conversion rates, which is why we made sure our marketing dashboard template lets you monitor them in an instance. A well-designed marketing analytics dashboard provides you with your conversion rates so you can see if your website is meeting your business goals. This is what business is all about, and our marketing analytics dashboard example allows you to compare your conversion rates by channel, campaign or landing page and easily identify the most valuable pages and sections on your site.
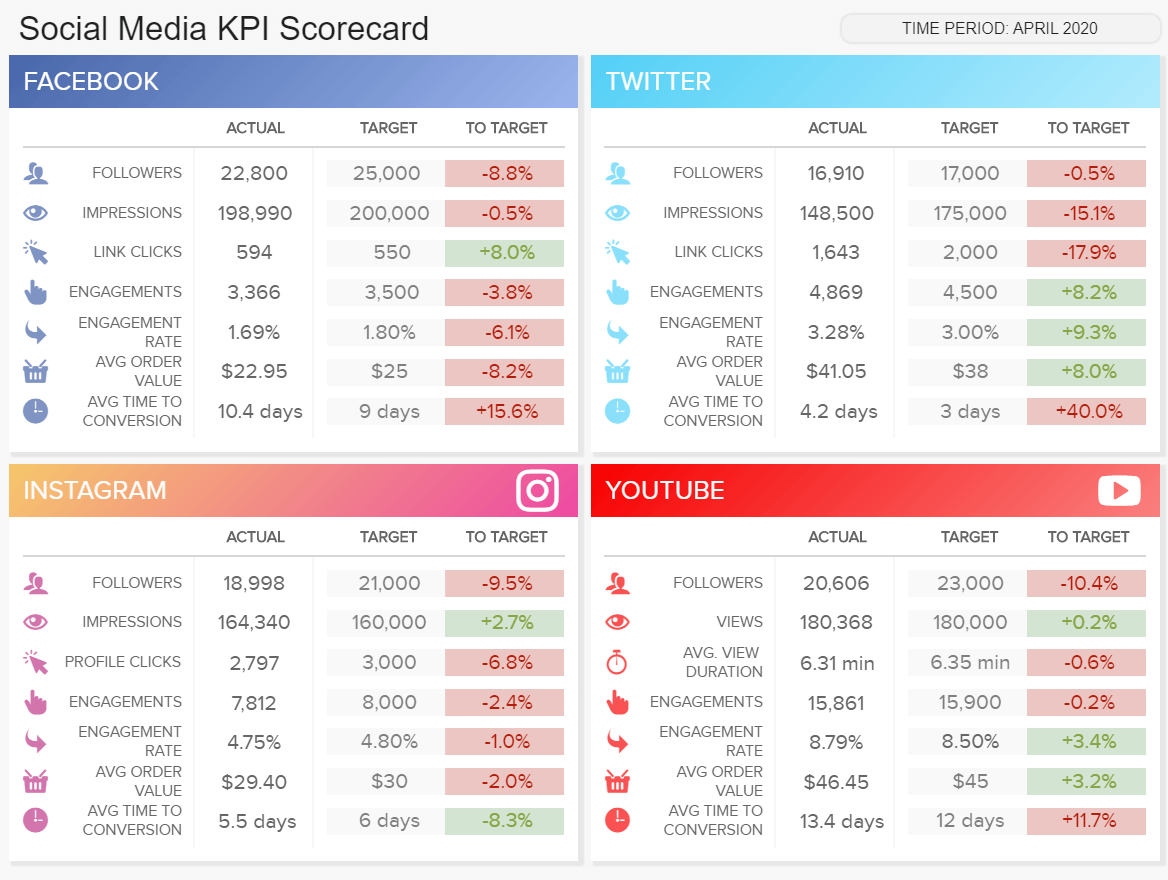
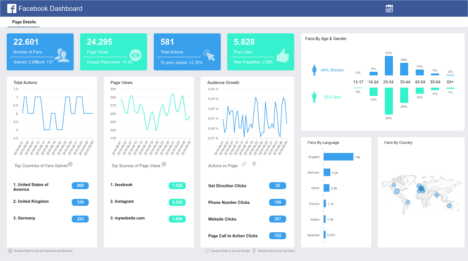
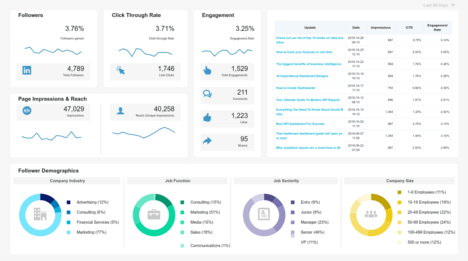
Our final digital marketing dashboard is focused on social media. To successfully manage performance, social media scorecard is usually one of the best ways to measure progress and achievements. Let’s take a closer look at our example.
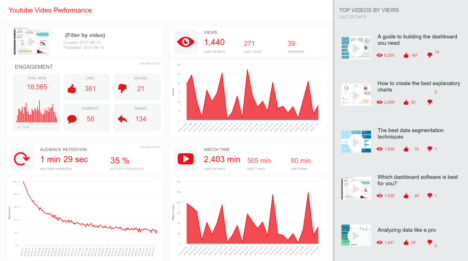
We can see this scorecard features 4 main social media channels: Facebook, Twitter, Instagram, and YouTube. Each channel is divided into a set of 7 metrics that are tracked in comparison to a set target and previous period. On Facebook, we can see that our number of followers is almost 9% below the set target, but 2.3% higher than the previous period. This part will simply tell us that our followers’ amount increased even though we haven’t achieved the target. We can apply the same logic into other depicted metrics: impressions, link clicks, engagement, average order value, and the average time to conversion. In the end, we can see that both the time to conversion and average order value have significantly decreased so we might want to investigate further what happened during our time frame and how to correct future performance.
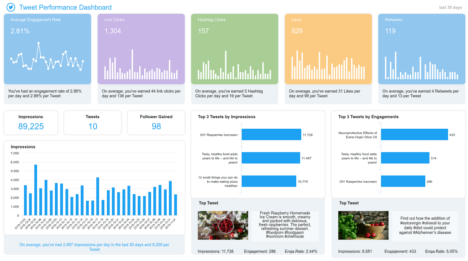
We continue our social media scorecard template with Twitter. As we can see, this part of the dashboard also contains operational metrics such as followers and impressions. The colour code will immediately tell you if the targets are being exceeded or fallen behind while the comparison to the previous period, in this case, monthly, will enable you to dig deeper into monthly correlations of your data. To put this into perspective, we can see that Twitter has issues with the number of link clicks, and the users’ time to convert. It even increased in comparison to the last month so we would certainly dig deeper to find out what went wrong: did the user behaviour change, our posts don’t show to the right audience, or a completely different reason? It’s time to investigate. This KPI scorecard can be also shown as a client marketing dashboard in case a social media manager tracks the performance of the client’s SMM (social media marketing) efforts within a designated time period. It can significantly reduce time to create manual social media reports for each campaign or agreed strategy while the simple visuals in red and green can provide insights immediately. Such a social media KPI scorecard is also invaluable for any SMM department that holds weekly or monthly meetings and discusses how has their online content performed and what needs to be improved in the future.
Concerned and curious about what should a marketing dashboard include and how to create a well-designed visual? Good news! datapine offers predefined dashboards that you can easily set up yourself in under two minutes. And if you want to take advantage of these dashboards in all your marketing processes, you can try our software for a 14-day trial, completely free!

Setup only takes one minute. No credit card required!