LinkedIn Dashboard examples
A LinkedIn dashboard allows the monitoring and reporting on important KPIs for your personal profile as well as for your company’s page and branding. It empowers business influencers and companies alike to analyse and optimise their LinkedIn activities.
Let's take a look at these 3 LinkedIn dashboard examples: LinkedIn Company Page Dashboard - LinkedIn Individual Profile Dashboard - LinkedIn KPI Dashboard.
LinkedIn Company Page Dashboard
Open LinkedIn Company Page Dashboard in Fullscreen
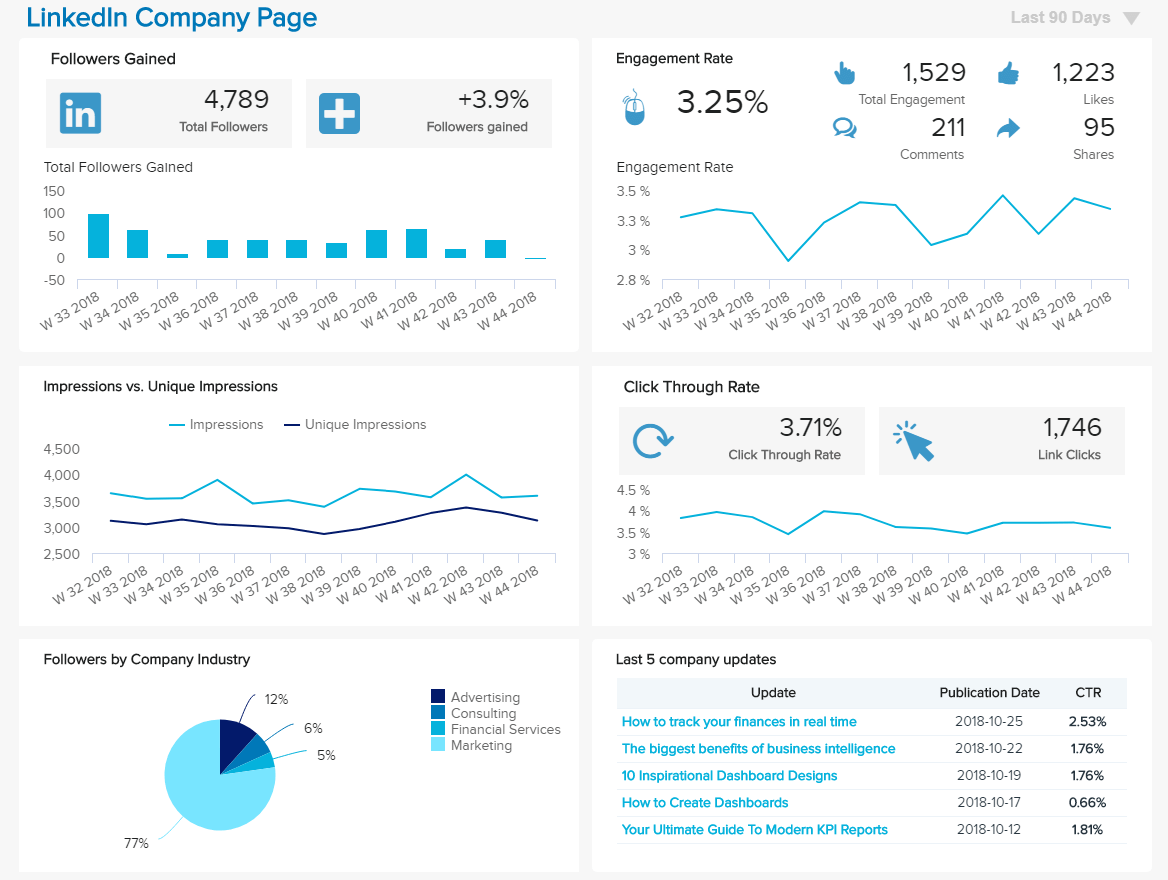
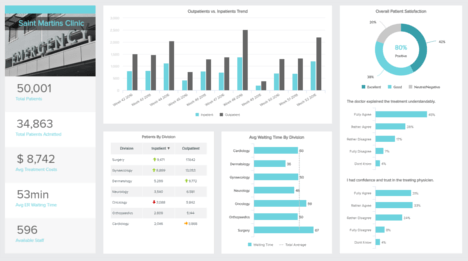
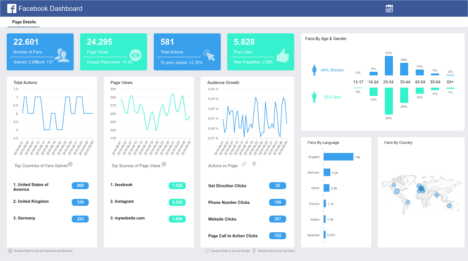
To understand how your company and brand is doing on social platforms, it is important to analyse a handful of metrics accordingly. Be warned though: not every metric fits all platforms, and you should thus pay attention to those that really matter for each of them. LinkedIn, a social network by and for professionals is particularly useful in a B2B context, hence the importance of producing meaningful reports.
On the LinkedIn company page dashboard above we have metrics essentially useful to the management of a company profile on LinkedIn. The first indicator displayed looks at the followers count, its evolution in percentage in the previous 90 days, as well as the evolution over the weeks. This total number of followers is broken down per company industry, but it would make sense to break down also on career level (junior, senior, manager, etc.) or job function. This visual, complemented with the exact percentage of your demographic’s metrics provides a clear overview on where your company page stands in regard to the followers you have gained. Having all these data at disposal is a huge advantage to understand your audience better and get to know them: who they are, their professional background, their position and industry. Thanks to all these insights, you can tailor content for your audience much better.
On the top right of our dashboard example, the users’ engagement is analysed namely with the percentage of the Engagement Rate (likes, comments, shares). Impressions and CTR will define how many people have seen your content and clicked the link. These metrics help you understand how your content is received, which posts spark the most attention and reactions, how it grows over time, and how to compare those insights to further create relevant content that will bring value for your overall strategic social media efforts. Your Updates’ engagement has also a special value, since you can clearly define which ones generate more Impression, bigger CTR and Engagement Rate, all important when you decide on what kind of content you should share to entice a reaction.
Having the opportunity to customise your LinkedIn dashboards more in detail, thanks to datapine, and combine their insights with those of other social platforms is a must. This holistic view of all of your social media efforts which you can analyse on a deep level, can deliver a cost-effective, time-reducing operational value and offer a profound insight into your social media strategies.
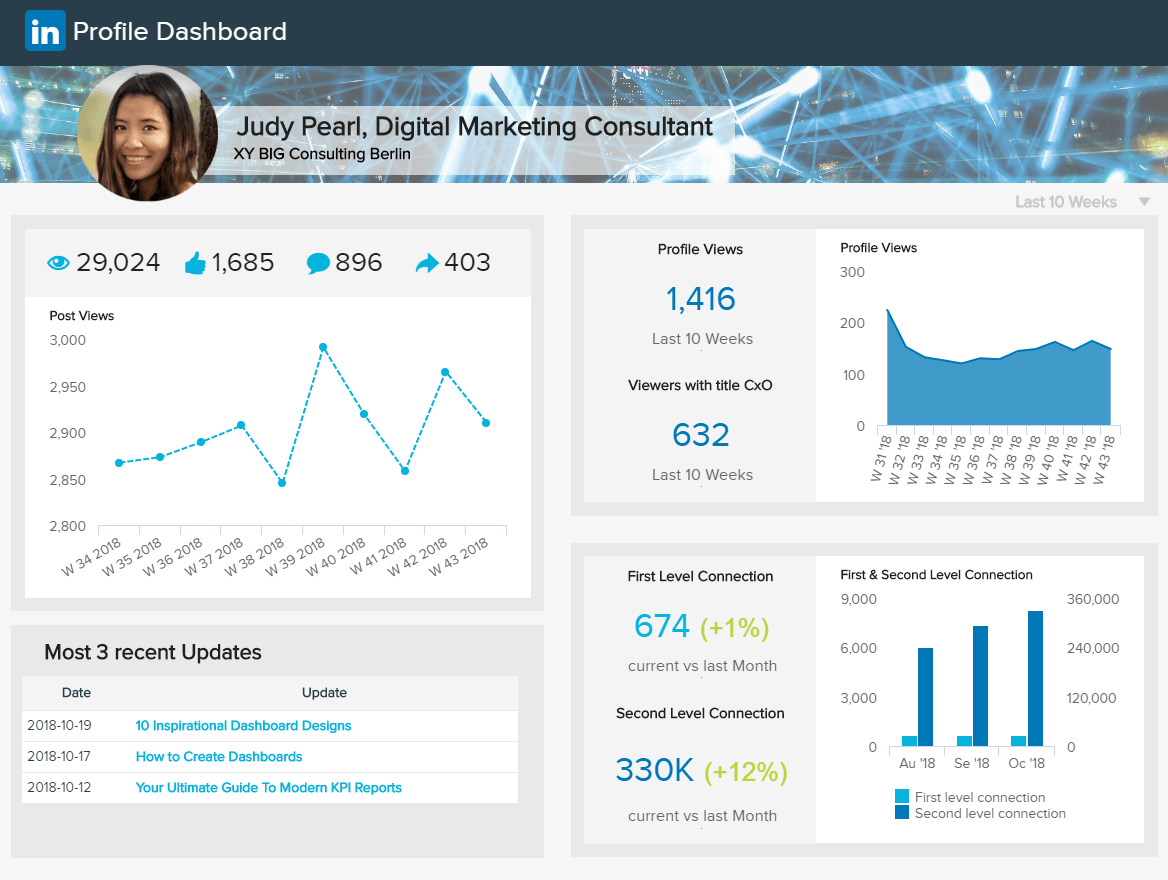
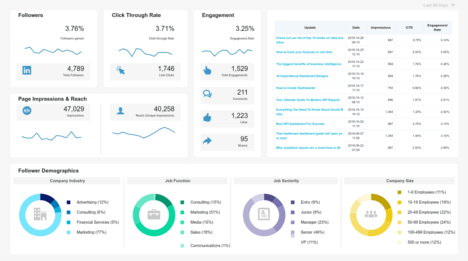
As we said above, LinkedIn is a platform for professionals and business influencers, meaning that its users can also benefit from analytics from their own profile. You can use the individual profile pages professionally, where you might need more detailed analysis to get the most out of your efforts.
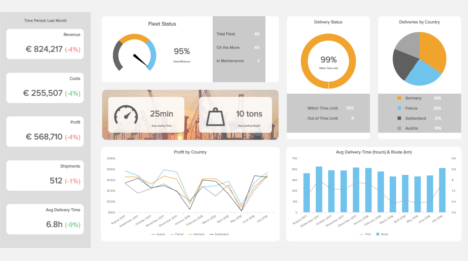
With datapine, you can gather all these metrics into one professional LinkedIn profile dashboard, as well as monitor them over time – a needed overview that makes sense of all the stats LinkedIn puts at disposal. On our second LinkedIn dashboard example above, the left column summarises Judy Pearl’s profile activity. It displays the numbers of Post Views she gained per week.
You can dig deeper into the behaviour of the above-mentioned metrics over time. Monitoring your profile views, your post views and 1st and 2nd connections will bring data from your LinkedIn profile dashboard into a lively view, which you can then edit and interact with, compiling deep insights on where to allocate your personal efforts on this business network. The clear overview of how many likes, comments and shares your posts have gained can easily identify how well they are received. If you see a spike, inspect more to see what kind of content generated the most reactions and implement that in your future postings. If you don’t reach your expected outcomes, test different approaches to see what works best.
Being aware of how your profile is doing is an important aspect for any professional eager to brand his/her name correctly, whether you are trying to get exposure through posts and articles, work in sales, seek employment, or just looking to network with others. Just like your brand, your professional profile should provide business updates, include relevant topics, engage with the industry professionals, your personal profile should include the same, but on a more personal level, of course. By gaining these critical insights through a professional dashboard, your hard work can be significantly reduced.
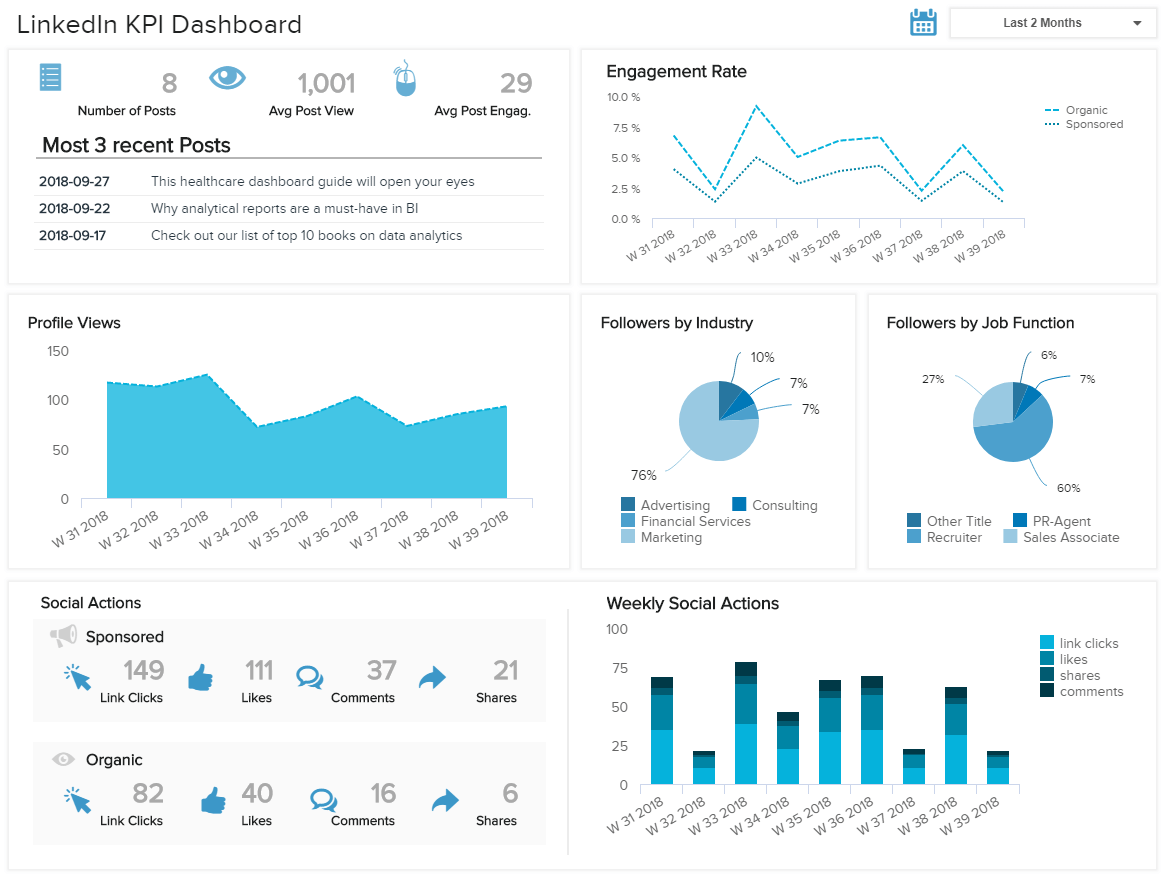
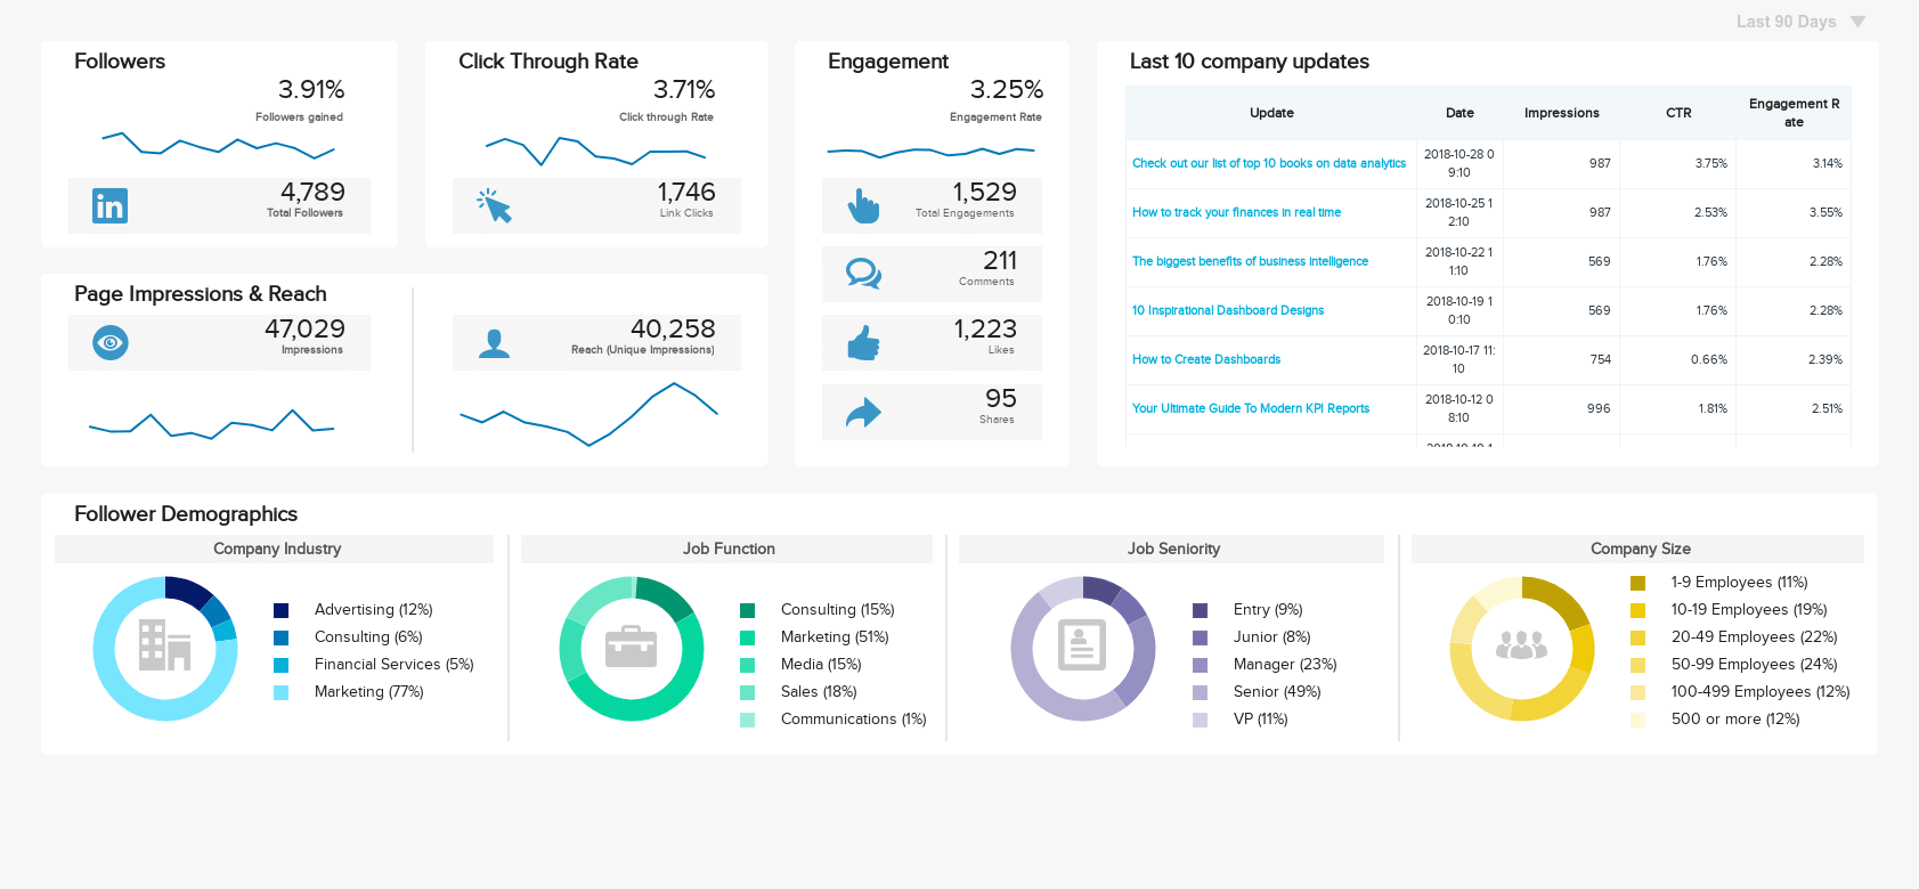
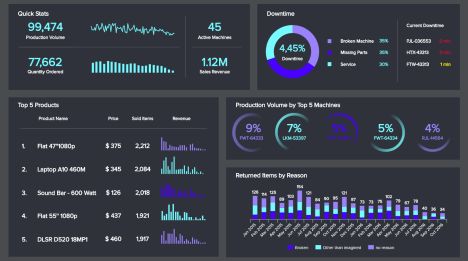
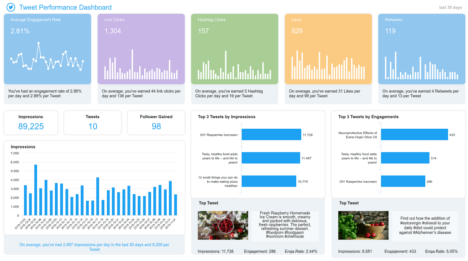
The LinkedIn KPI dashboard provides the most valuable insights in a one, single, interactive place. datapine provides profound, yet simple, and easy to understand LinkedIn dashboard examples, that can customize and implement important metrics such as Impressions, Link Clicks, Engagement, Social Actions, Engagement Rate, Followers Gained, Number of Posts, etc. All those KPIs presented into a single dashboard provide a holistic overview of all your social media efforts invested and gained on this network.
The first top of the dashboard includes what happened with the most recent posts you have published. How many posts in total, Average Post Views and Average Post Actions will provide a more detailed overview on how your content is perceived when shared. You can also clearly differentiate the Organic and Sponsored Social Actions, so you can compare and evaluate this data. Following the Engagement Rate, your assessment of data in the past weeks or months can be easily seen through this simple interactive dashboard.
The time spent while analysing your campaigns and organic reach can be now reduced into just a few clicks, and, with datapine, you don’t need an additional analyst. Your follower’s analysis is one of the most important KPI to track, in addition to the Engagement section. You have to get to know people who are interacting and tracking your content regularly, so that you don’t lose focus on where your strategy should go. If you see a big spike into the follower’s section from an industry that is not related to yours, then you should ask yourself what draw them in and do you have any relevant connection with that part of the network. While you can summarise your analysis on a weekly basis, don’t forget your own customisation: a monthly view is more important when you track your long-term strategy, and weeks can provide an optimisation approach and controlling checks of your sponsored and organic content.
To track your specific Key Performance Indicators, to create your own dashboard in just a few clicks and manage a large set of social data in just one interactive dashboard, be sure to try our software – 14 days completely free!

Setup only takes one minute. No credit card required!