Logistics Dashboard examples
A logistics dashboard allows for the monitoring and reporting on important logistics KPIs concerning warehouse operations, transportation processes and the overall supply chain management. It is a modern analytics tool that helps to visualise and optimise logistics operations through advanced data analyses.
As a logistics organisation, how to keep up with today’s thriving global economy where the customer is always more used to instant satisfaction? The answer is simple: it’s not a piece of cake. To manage all the ebbs and flows of your logistics processes, you need to track essential data that will help you extract actionable insights to drive your business success. With datapine’s BI dashboard software you can manage all your logistics data in one place and visualise it with interactive online dashboards updated in real time. By getting all your relevant logistics metrics together in one professional dashboard, businesses can efficiently manage their operations in an efficient way, find trends, and spot any potential issues to ensure a high-quality service. We’ll show you how with 5 industry examples.
In this article we present you 5 professional logistics dashboard examples for different application areas:
Transportation Dashboard - Warehouse KPI Dashboard - Supply Chain Dashboard - Pick & Pack Scorecard - COO KPI Scorecard
Transportation Dashboard
Open Transportation Dashboard in Fullscreen

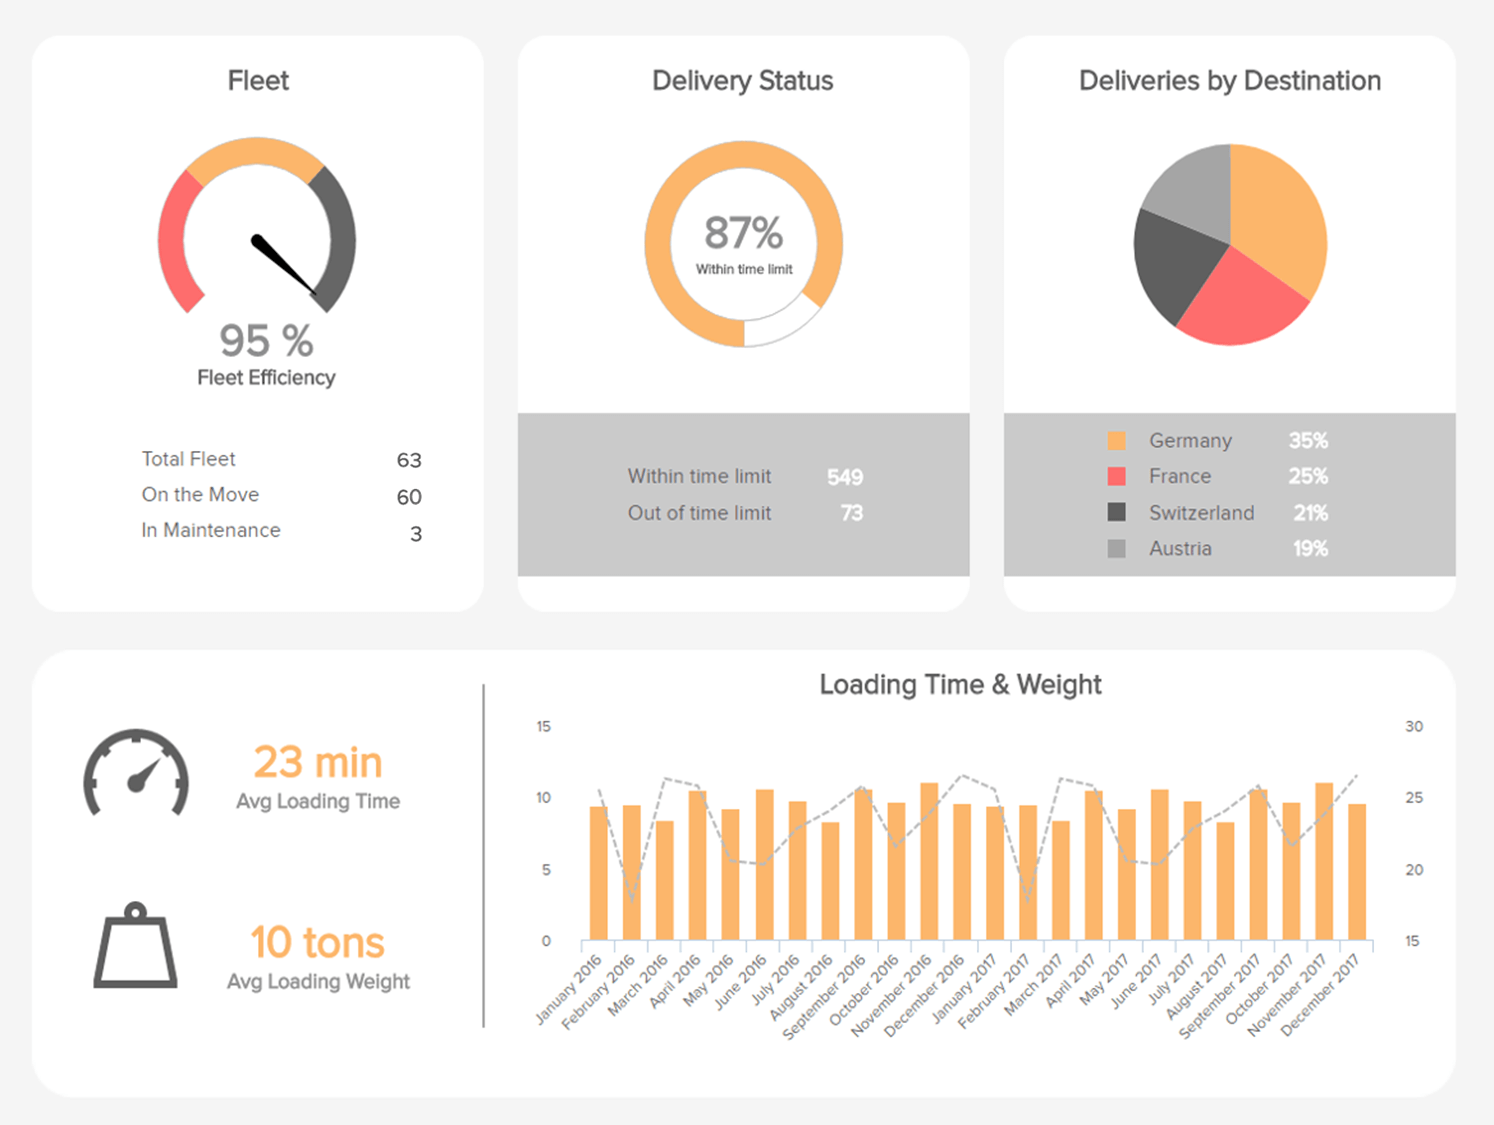
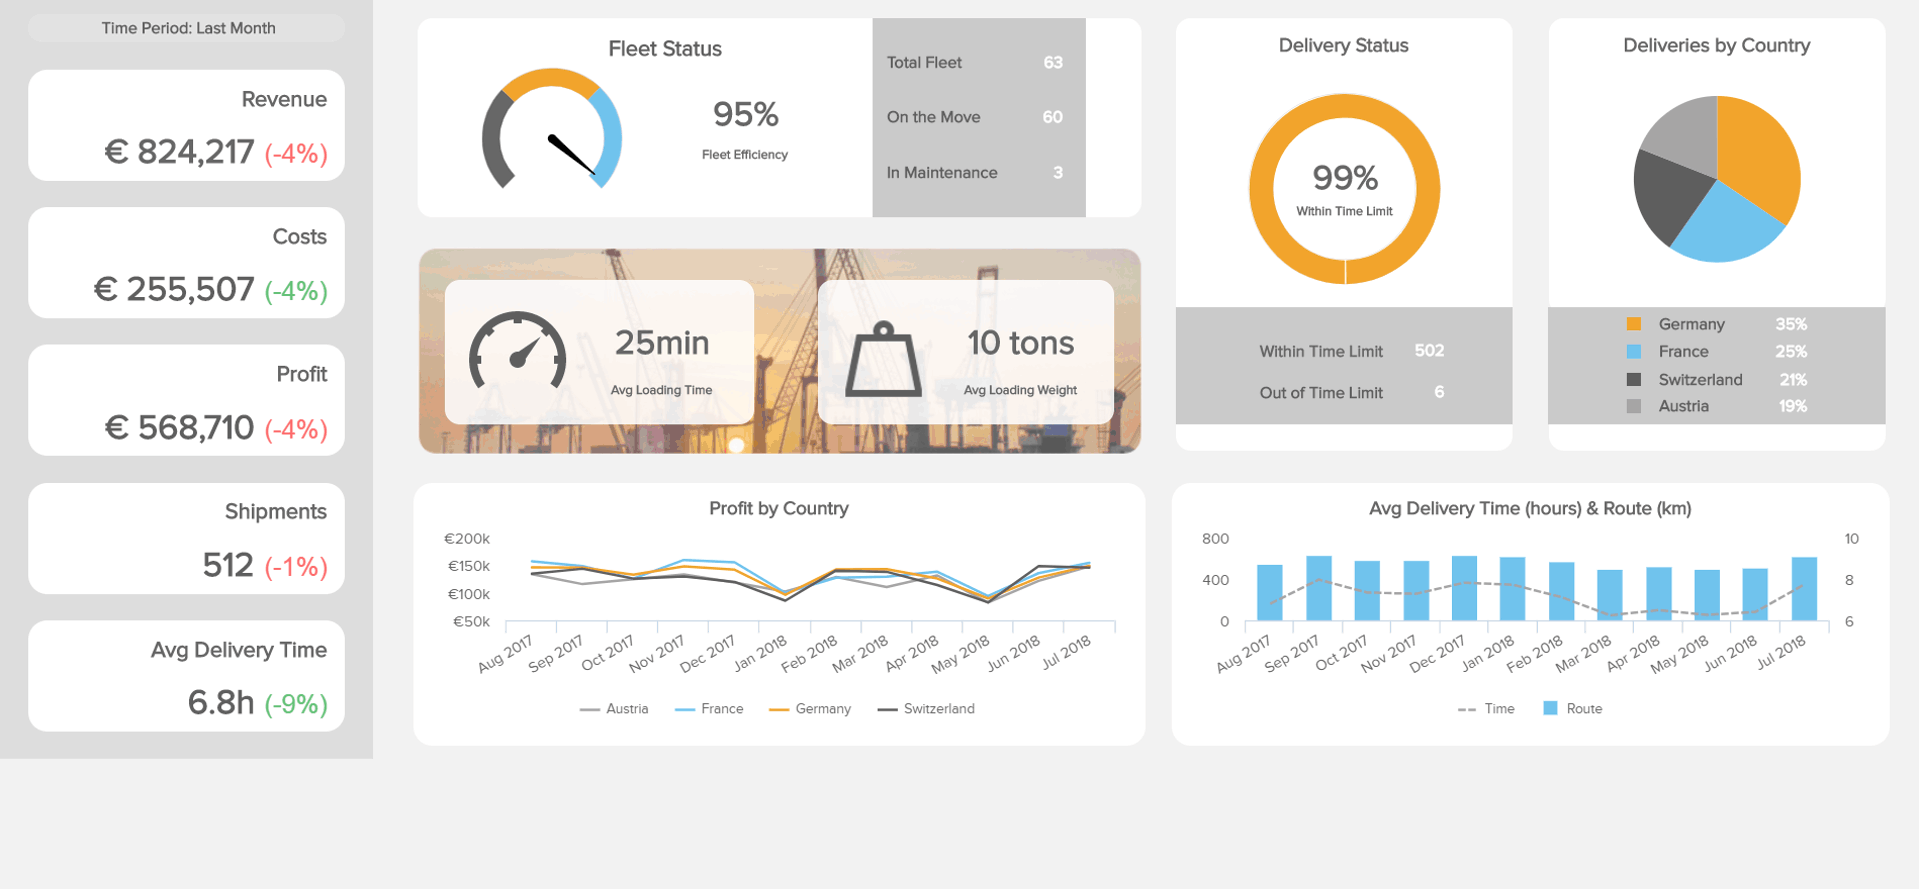
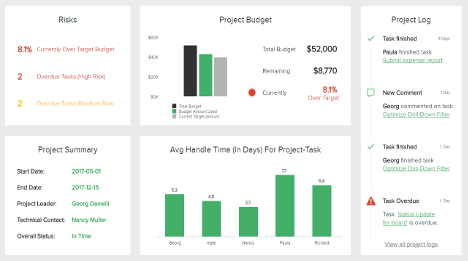
Five metrics are displayed on the logistics dashboard template provided above, each bringing valuable information to transportation management. Monitoring your Loading Time and its Weight is a primary KPI to measure, as it will impact the rest of the transport’s efficiency. Knowing how long it takes your fleet to be loaded according to its weight will let you evaluate a certain time per ton and set targets for loading time. Optimising this time will consequently let you load more and transport more; but keep your targets realistic, as a rushed shipment often turns into a crushed shipment. Monitoring it over time will also enable you to identify trends and patterns that can translate to a certain difficulty or on the contrary a greater efficiency; it can also give you insights into the functioning of your supply chain.
Acknowledging this data is helpful when you want to allocate resources more efficiently. You might as well need such information to dig deeper and categorise it: which orders are the heavier and need more people to be loaded? On the contrary, are there others, that do not require a lot of workforces but are more time-consuming when it comes to loading them? According to the answers you find, you can then act with full comprehension of your transportation management.
Your fleet and the people driving it are your number one asset. This is why it is important to maintain it as efficiently as possible, by always optimising the utilisation of trailer capacity, and reducing at the same time the CO2 emissions in the environment and the fuel consumption. The management of the routes is another important aspect. The deliveries, as a last step in the completion of an order placed online, are a demonstration of your company’s efficiency and reliability. They should be carried out in the timeframe originally given to your customer and with the correct order undamaged. Without all of these checkboxes ticked, the image of your business might suffer from it.
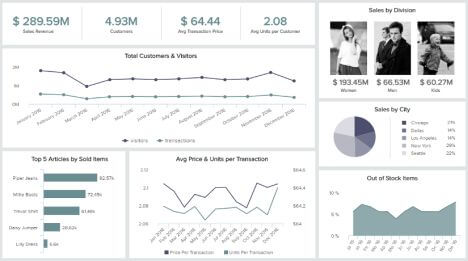
As a warehouse manager, you need to have an instant overview of your facility and know at one glance whether your factory is meeting its goals and sustaining a reliable performance. To carry this out, you need to track the right metrics and watch the operations. We have aggregated several KPIs to help you out with that in another logistics dashboard example.
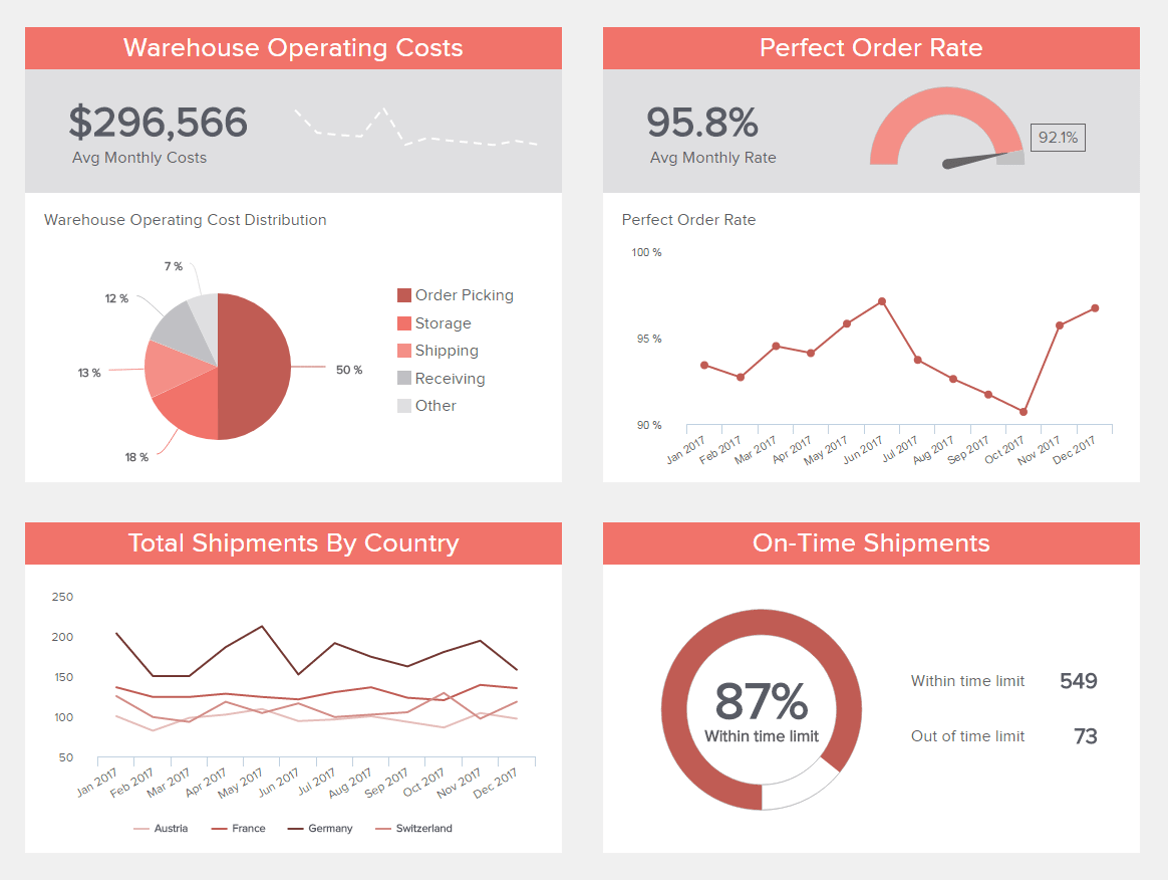
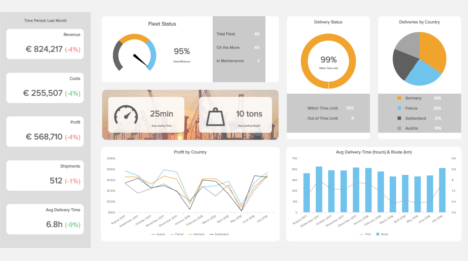
Directly impacting the previous dashboard data is the On-time Shipments: if these ones are late, so will the loading be - and with the possibility of creating future bottle-necks- and so will the deliveries be as well. On-time shipment, being the ratio of orders placed that are ready to be shipped within the time limit set, it is important to bring it as close to the hundred percent as possible. It indeed measures the performance in the management of your supply chain; if this metric is too low, that may translate into trouble in the process between order placement and shipment, due to an increased demand that cannot be answered, or to planning processes that are not up to date for instance. Once the on-time shipment is managed, the other KPI worthy of measuring is the Order Accuracy. Having a perfect order rate as high as possible will ensure satisfied customers that will come back to your services, and guarantee them to friends and family. A perfect order is an order processed, shipped, and delivered without any incident in between placement and arrival to the customer. It is on time, neither damaged nor inaccurate. If managed correctly, you will also save money in avoiding losses in returned goods that need to be shipped again.
In this logistics dashboard example, you can also monitor your Operating Costs. These embrace various aspects of your warehousing management, from the expenses covering equipment, energy consumed, and material used, to more human-related ones like labour, shipment fulfilment, and delivery. These operating costs will give you a great overview of the expenses required to process one order, and adjust the price accordingly so that your warehouse can sustain itself. It will also help you identify the different entry costs and their evolution over time. Comparing them to the same period a year early can be an interesting source of insight.
Finally, the Total Number of Shipments is a great metric to evaluate as it can serve as an indicator in the future: knowing the shipments trends over time enables you to be better prepared in terms of human workforce and inventory storage when rush hours of the day or rush periods of the year are upcoming.
The bottom line of this logistics dashboard is, of course, to have better warehouse management that enables smooth operations, increasing efficiency, and growing revenue.
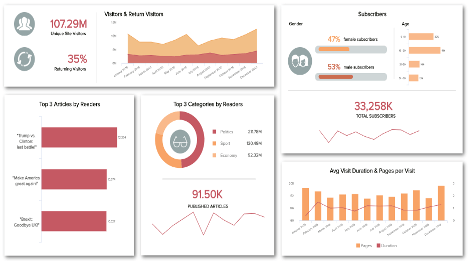
To deal with today’s global economy and its many challenges, logistics companies need to rethink the supply chain and transform it into a data-driven value chain. Our next logistics dashboard template will help you do just that by focusing on the supply chain and inventory management.
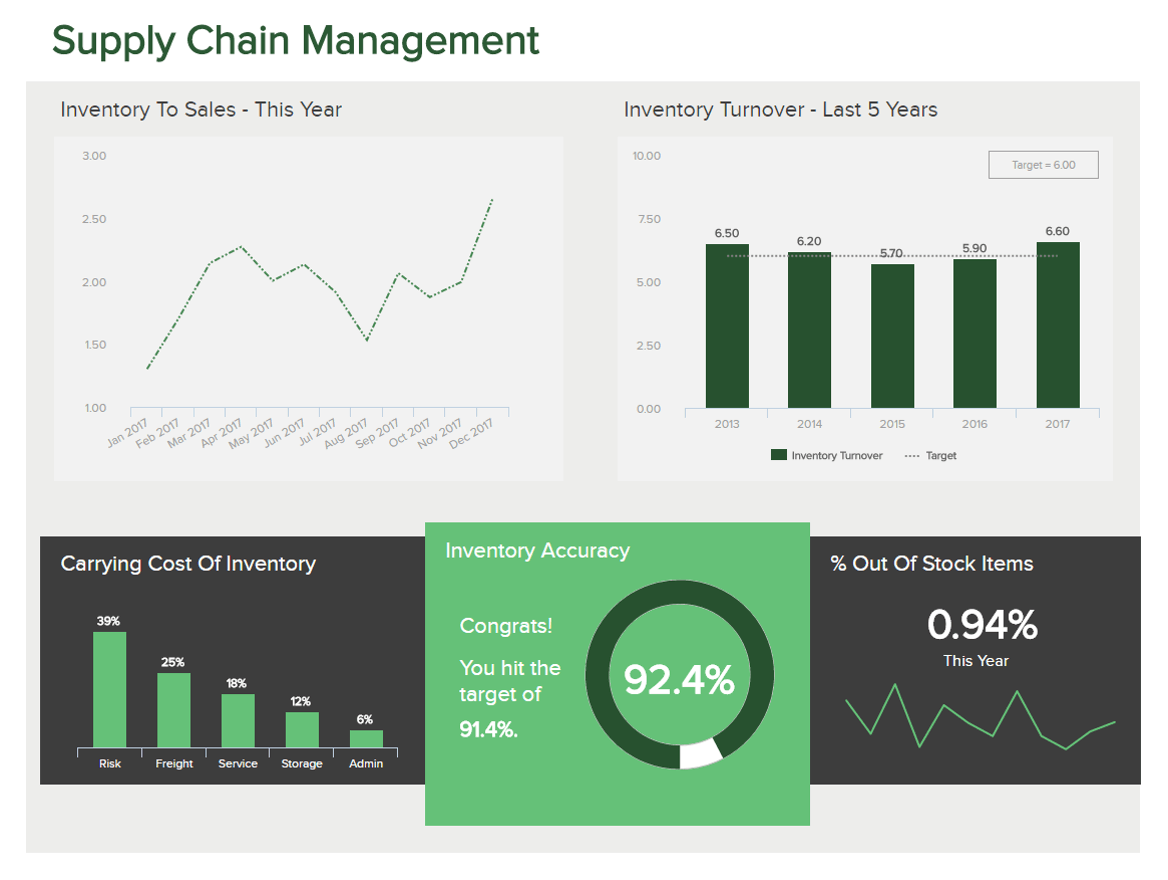
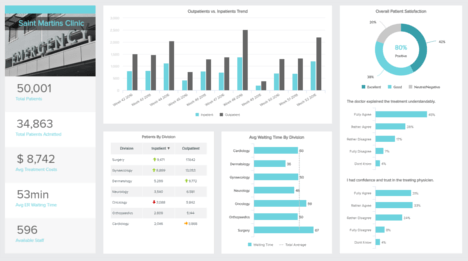
Starting by analysing the Inventory-to-Sales ratio, you can have a first performance barometer, as it is a good indicator when it comes to dealing with the unexpected. This metric is the ratio between the value of the items that are in stocks divided by the total value of the sales orders you are fulfilling; the objective is usually to maintain it low. Combine this metric with the next one, Inventory Turnover, and you will have a great overview of the financial stability of your business. The inventory turnover will measure the number of times your organisation manages to sell its entire inventory in a year. This is a good efficiency index, as well as an important indicator of your demand and how you answer it: good buying practices, good time shipment, time management, etc. The higher your turnover rate is, the better. A low turnover rate translates into an incapacity to turn your goods into sales.
The third KPI of this logistics dashboard is the Carrying Cost of Inventory, which measures the cost of storing and maintaining your goods in stock. Expressed as a percentage, it evaluates the costs of capital, storage space, inventory services, and inventory risk. The annual amount of these costs is summed up and divided by the average inventory investment, and it is commonly accepted that its values range between 20-25% of the inventory value on hand. Maintaining inventories is necessary for any organisation, but the question is know how much of this inventory is obsolete or in excess? The objective is to reduce these costs while having a high inventory turnover. At the same time, we can often observe empty shelves and racks in the warehouse, which are increasing the Out-of-Stock rate. This ratio is measured by dividing the number of stock-outs when the customer placed the order by the number of items in stock. Keeping this ratio as low as possible avoids frustrated customers.
Last but not least, it is another inventory-related KPI that will tell a lot about your inventory management: Inventory Accuracy. If your electronic version inventory does not match your actual physical inventory, it will harm your business probably more than stock-outs. It is of course normal to have discrepancies, but you must set a target and try as much as possible to keep your inventory up-to-date and this ratio as high as possible. Your business will then appear more reliable, and you will avoid wasting money while increasing customer retention at the same time.
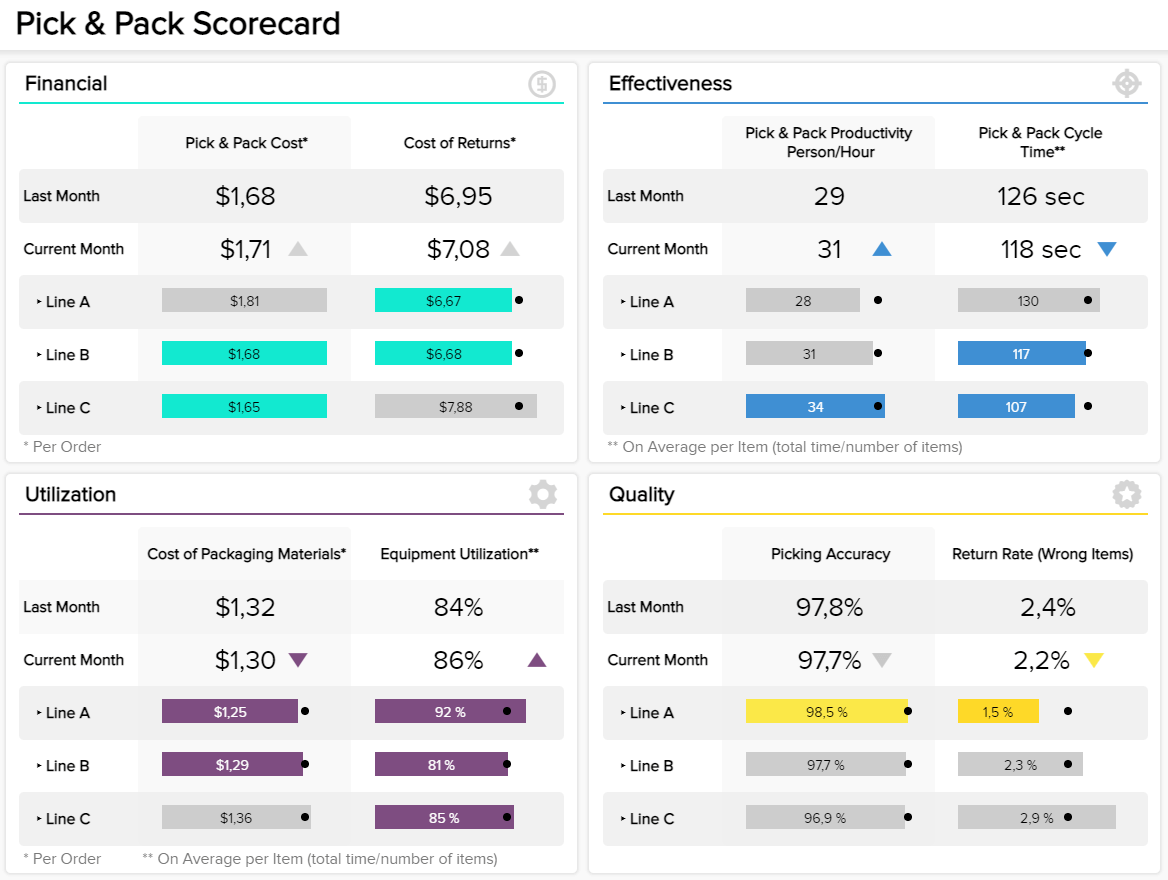
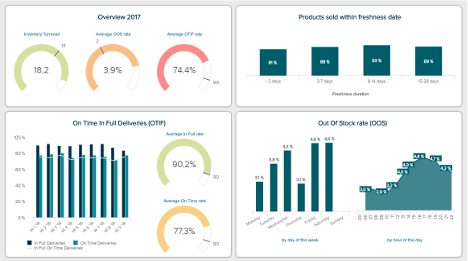
Our fourth example is a warehouse KPI scorecard that tracks the entire order processing in logistics. Better known as pick and pack, it is the procedure in which a worker finds the item from an order in the warehouse and puts it in a box or other type of packaging to be shipped to the customer. Thanks to advanced picking and packing analysis and techniques, businesses like e-commerce or retailers can efficiently manage their supply chain as well as save money and time with effective processes.
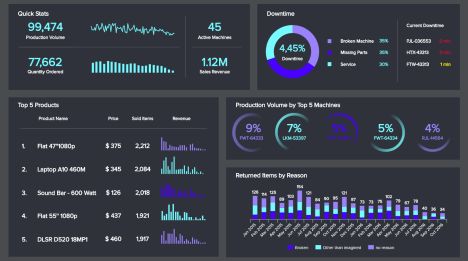
Our pick & pack dashboard example is divided into 4 big areas to measure performance: financial, effectiveness, utilisation, and quality. Starting off with the financial section, we first see the costs of picking and packing; this refers to all the expenses related to the process. Alongside this metric is the costs of returns KPI, which is basically how much money the company is spending when a client returns a package. This should always be as lower as possible since returns are one of the most expensive processes for your warehouse. Next, the dashboard breaks down these costs for the 3 different lines. Tracking each line separately allows you to try different methods for picking and packing and monitor which one is more effective cost-wise. If you use the same method for all lines but see that one is underperforming, you can analyse it in detail to find the reasons and take the right actions to optimise it.
Going a little deeper into the costs of resources comes the utilisation part of this pick and pack warehousing dashboard. First, we see the costs of packaging materials, the goal here is to make sure you don’t spend more materials than you need to since it can increase the total costs of your entire pick and pack process. Additionally, the environmental aspect of packaging is a critical issue for clients and your company should not stay behind. Next to it, we have the equipment utilisation in a percentage. This helps you understand if your equipment is enough to reach the expected performance of your warehouse. A higher equipment utilisation than 90% could mean that your employees have to wait in line to use a machine delaying the whole pick and pack process.
Moving on to the right side of the dashboard, we have the effectiveness section which aims to track the average picking time and the average packing time. Just like in the financial area, these metrics are also useful to understand the productivity of your employees as well as the effectiveness of your logistics processes. Finally, the quality section is directly related to the satisfaction area of your logistics warehouse. The picking accuracy tracks the percentage of shipped orders that were accurately picked, and the return rate tracks the percentage of wrong items delivered to customers. Having efficient picking accuracy techniques in place can help your business significantly reduce the costs of returns.
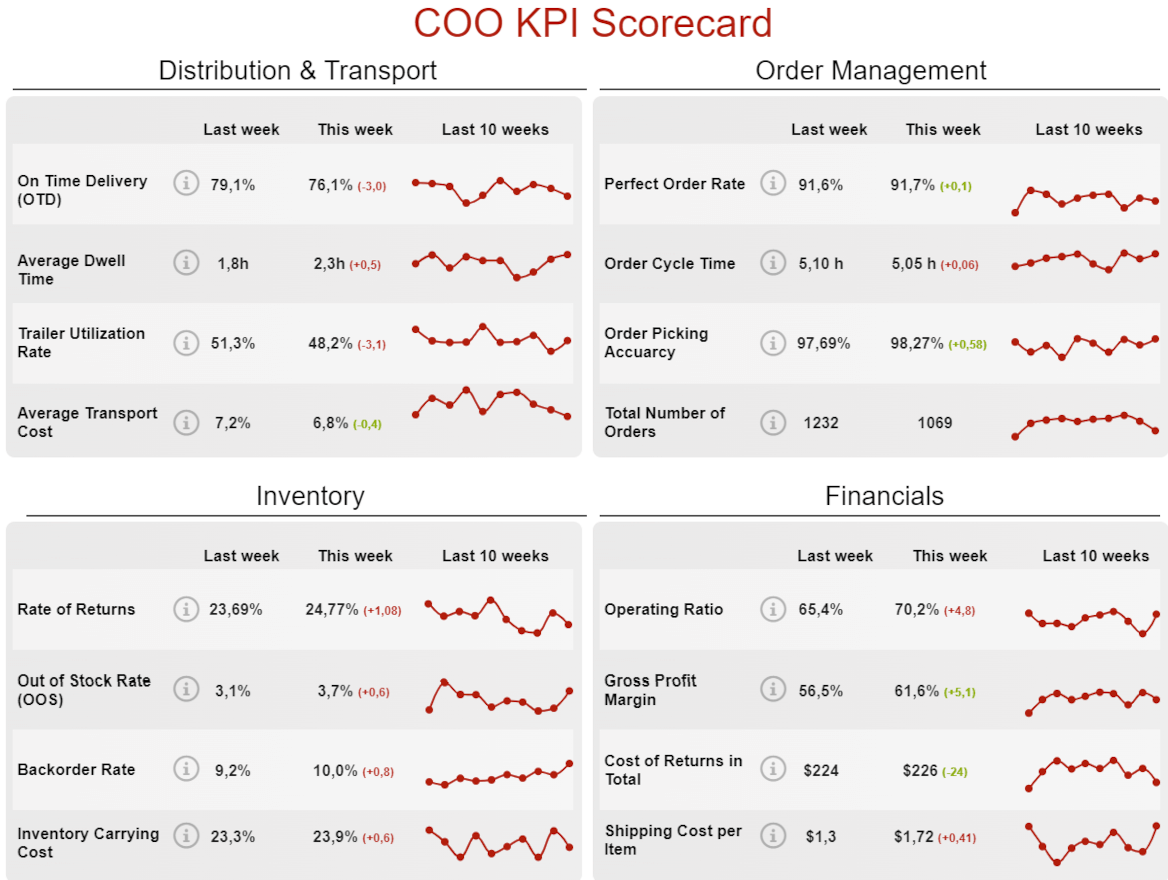
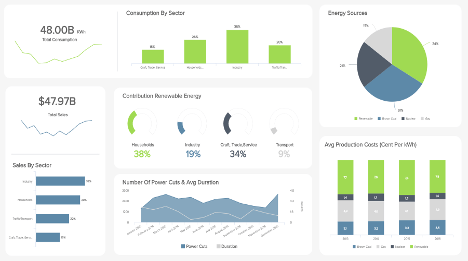
The fifth and last example of this insightful list of logistics dashboards is another scorecard format. This time, offering a 360-view of all relevant areas for a Chief Operating Officer (COO). The template comprises 4 key areas tracking KPIs related to distribution & transport, order management, inventory, and finances. Each area from this design has a short-term approach with values for the current week, a comparison to last week, and a trend line for the past 10 weeks. With these insights in hand, COOs can make informed decisions and ensure successful operations across the board.
Starting at the top, we first get data about the distribution & transport area. This concerns time deliveries, trailer utilisation rates, and their related costs. Here, we can see a positive development in transport costs with a slight improvement since last week and a descendant trend in the past three weeks. However, we can also observe a more significant shift in the on-time delivery KPI, a trend that has also been happening for the past three weeks. Again, this is something that the COO needs to look into as delivery times significantly influence customer satisfaction rates.
To get more insights into the reasons for this trend, we can go into the inventory area and observe that some other relevant KPIs are underperforming compared to the previous week. For example, the out-of-stock rate went from 3.2% in week 47 to 3.9% in week 48, which can clearly affect delivery times. You can see the exact values for the 10-week line chart in the live version of the dashboard by hovering over each data point. The live version of this template also offers a comparison of this year vs. last year. There, we can observe that, overall, the on-time delivery is going better this year than the last. However, it still needs to be looked at closely to keep these numbers positive.
Moving on to the other two dashboard sections, we first have the order management section with relevant KPIs such as the perfect order rate, order cycle time, and picking accuracy. Here we can observe more positive numbers overall, especially with the perfect order rate and picking accuracy, which means customers might be getting their orders a little late but without any serious issues.
These insights translate into the financial section, where the COO can analyse the financial outcomes of the entire supply chain process. For instance, the operating ratio for the current week is 4.8% higher. This is not surprising as there were some issues with distribution, transportation, and inventory, which increased costs. That said, these issues are not major as the comparison from this year to the last remains positive.
This list of logistic dashboard examples should help you understand the power of data visualisation for performance tracking and the optimisation of several logistics processes. If you want to start building your own professional logistic dashboard, try our dashboard software for a 14-day trial, completely free!


Setup only takes one minute. No credit card required!