
Business Intelligence Tools Discover a List of The 15 Best BI Tools On The Market
Top BI Software, Applications & Platforms Reviewed
Table of Content
1) What are BI tools?
2) What are the benefits of BI tools?
3) What are the best BI tools on the market?
Ensuring all business processes are under control is getting harder each year since the massive volumes of data being produced challenges businesses of all sizes. Ultimately, organisations and companies need certain help when it comes to making sustainable and profitable decisions. By utilising modern and professional business intelligence tools (BI tools), each challenge can be addressed promptly by any business user, without the need for massive IT involvement.
These tools step up into collecting, analysing, monitoring, and predicting future business scenarios by creating a clear perspective of all the data a company manages. Identifying trends, enabling self-service analytics, utilising powerful visualisations, and offering professional BI dashboards are becoming the standard in business operations, strategic development, and ultimately, indispensable tools in increasing profit. And not just that, the self-service nature of these solutions gives access to every feature we just mentioned to all levels of users, without the need for any technical skills or specialised training. Making them the perfect solution to democratise the data analysis process and boost business performance.
Here we will explain what is a BI tool, offer the most prominent benefits that a company can obtain by using them and provide a list of the top BI tools on the market with a review of each. To build this list in the most accurate way, we took into consideration two of the most prominent websites for software comparisons and user reviews. On one side, we have Capterra which is also a part of the Gartner family, the world’s leading advisory and research company. And on the other side, we have G2Crowd, one of Gartner’s biggest competitors and a major player in the review’s market for over a decade. For our investigation, we took the business intelligence software platforms with the best rankings on both websites with a minimum of 50 reviews between both of them.
1) What are BI tools?
BI tools are types of software used to gather, process, analyse, and visualise large volumes of past, current, and future data in order to generate actionable business insights, create interactive reports, and simplify the decision-making processes.
These business intelligence platforms include key features such as data visualisation, visual analytics, interactive dashboarding, and KPI scorecards. Additionally, they enable users to utilise automated reporting and predictive analytics features based on self-service all of this in one single solution, which makes the analysis process efficient and accessible.
But what are the exact benefits of these BI applications and what do they offer that traditional means of data management cannot? It all starts with technology.
2) The benefits of business intelligence tools
Professional BI software and tools offer various prominent benefits, here we will focus on the most invaluable ones:
They bring together all relevant data: Whether you work in a small company or large enterprise, you probably collect data from various portals, ERPs, CRMs, flat files, databases, APIs, and much more. You need to obtain a high level of data intelligence to be able to manage all these sources and develop a better understanding of the collected information. That’s why utilising modern data connectors will help you in centralising disparate sources and provide you with a single point of view on all your business processes. That way, identifying issues, trends, performing crossed-analysis, and taking action are closely connected and based solely on data.
Their true self-service analytics approaches unlock data access: When each person in the company is equipped with modern business intelligence software that will enable him/her to explore the data on their own, the need to request reports from the IT department is significantly reduced. This self-service BI approach gives organisations a competitive advantage because each employee will be equipped with the right amount of data analytics skills that will, ultimately, save the company’s time and resources while unburdening the IT department, hence, enabling them to focus on other critical tasks.
Users can take advantage of predictions: Predictive analytics doesn’t need to be a specialty of data scientists or analysts. With the integration of forecast engines business users of any level of expertise can easily generate insights for future scenarios that will help them in adjusting current strategies to deliver the best possible results. On the other hand, if a business condition changes, intelligent data alerts powered by artificial intelligence safeguard the anomalies that can occur while you manage huge amounts of data, and discover new trends and patterns that will enable you to react immediately. This level of technology allows you to cut the manual work and automate processes to have enough time to perform other tasks.
They eliminate manual tasks: While traditional means of business management encourage the use of spreadsheets and static presentations, modern software eliminates endless amounts of rows and columns and facilitates the automation of processes. Need a report? The tool updates your KPI dashboard itself with real-time data. Besides, you can automate the reporting process with specified time intervals and purely look at the results. Need a presentation? Simply drag-and-drop your values and see how you can easily create a powerful interactive dashboard that enables you to directly interact with your data all in one screen. Leaving infinite PowerPoint presentations in the past and welcoming a much more intuitive approach to data analysis.
They reduce business costs: From sales planning and customer behaviour analysis to real-time process monitoring and offer optimisation, BI platforms enable faster planning, analysis, and reporting processes. In fact, according to a survey conducted by the BI survey, more than 50% of business intelligence users reported that these are the most prominent benefits that helped them reduce costs, and increase revenues. If you can work fast and accurately, you can achieve far better business results and make profitable adjustments.
They’re constantly at your service, 24/7/365: Various organisations require several needs and the Software-as-a-Service model offered by these tools will provide a full SaaS BI experience, with all the data hosted in a secure online environment. According to your needs, the software can scale or de-scale, thus, adjusting to the specific needs of a company. Since the data is stored on a cloud, you have non-stop access to the software, where you can fully explore various self-service analytics features no matter if you’re a manager, data scientist, analyst, or consultant. All you need is a browser and an internet connection and your data will be available to you on any smart device.
They provide a competitive advantage: Businesses who manage to use the massive amounts of data they produce to their advantage can set themselves apart from competitors in a big way. BI tools offer the necessary knowledge and functionalities to efficiently manage business data in a way that propels productivity and growth. Being able to make informed strategic decisions is an invaluable benefit that organisations across industries gain from working with the right BI software.
These benefits of business intelligence are focused both on small companies and large enterprises. If you need to control your data and know what’s going on in your company, BI is the way to do so. To help you on the way, we have created a top business intelligence tools list that not only will ensure your data management and discovery become intuitive and easy to use, but also stay secured and guarantee a higher level of productivity, and, consequently, increased profits.
The best BI tools on the market – a detailed review
We have chosen the 15 most popular BI tools that are leaders in the business intelligence community, often mentioned in industry articles, and obtained a favourable level of user reviews on Capterra and G2Crowd, as mentioned. The order of the tools is random and doesn't represent a grading or ranking system in any form. The rankings mentioned on this list were collected until November 2022. Let’s get started!
1. datapine
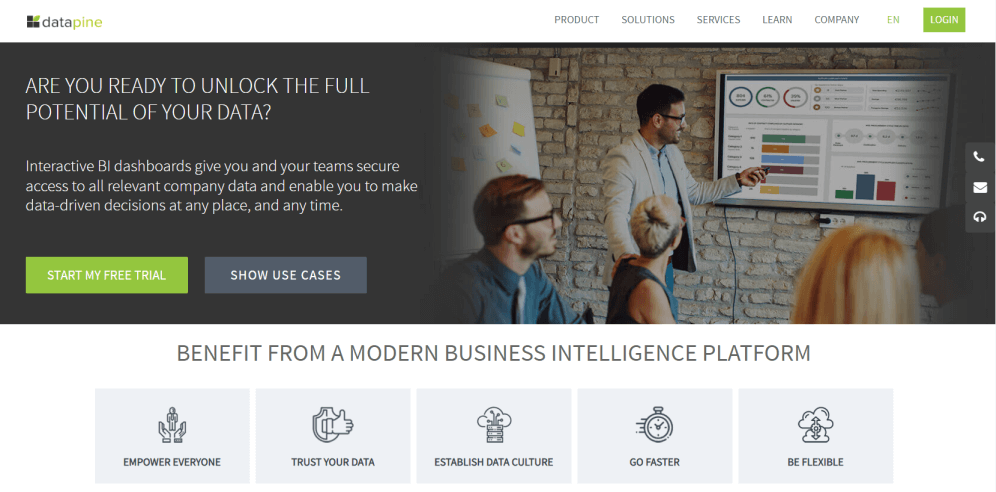
datapine is a BI software that lets you connect your data from various sources and analyse them with advanced features (including predictive analytics and artificial intelligence). With all your data in hand, you can create a powerful business dashboard (or several), generate standard or customised reports, or incorporate intelligent alerts to get notified of anomalies and targets. This tool, rated with outstanding 4.8 stars on Capterra and 4.6 on G2Crowd, is a powerful solution for businesses of all sizes since datapine can be implemented for various industries, functions, and platforms, no matter the size.
The software offers features for both advanced users such as data analysts and average business users. The SQL mode enables analysts to create their own queries while, on the other hand, the intuitive drag-and-drop interface ensures a visually intuitive way of entering your values and creating powerful charts and dashboards, simply by using effective visual analytics.
KEY FEATURES:
Intuitive drag-and-drop interface: Simply drag your KPIs into the interface and see how your charts and graphs transform into a professional dashboard without any IT involvement or advanced coding.
Easy-to-use predictive analytics: Advanced analytics features, including predictive analysis based on a forecast engine, where you simply select the KPI, determine the number of data points you want to forecast, specify the previous data points for the calculation, and finally define the model quality by appointing the desired confidence interval.
Many interactive dashboard features: Dig deep into each part of the dashboard with advanced dashboard software features such as drill-downs, chart zooms, widget linking, and hierarchical filters, among others, that will ensure a detailed data discovery process.
Multiple reporting options: Take advantage of BI reporting tools and create standard or customised reports by sharing via password-protected live URL, enabling viewer access, or sending an e-mail report which you can automate at specific time intervals. Additionally, you can embed datapine into your own application and get all the benefits of BI software without spending all the money and resources on one of your own.
Smart insights and alarms based on artificial intelligence: With artificial intelligence, machine learning, and pattern recognition technologies, they alert the user if a business anomaly occurs or generate multiple types of insights, including growth, trends, value drivers, what-if scenarios, among others.
SHORTCOMINGS:
They do offer mobile access, but the dashboards are not directly accessible unless you download their app and customise them within the mobile view.
2. SAS Business Intelligence
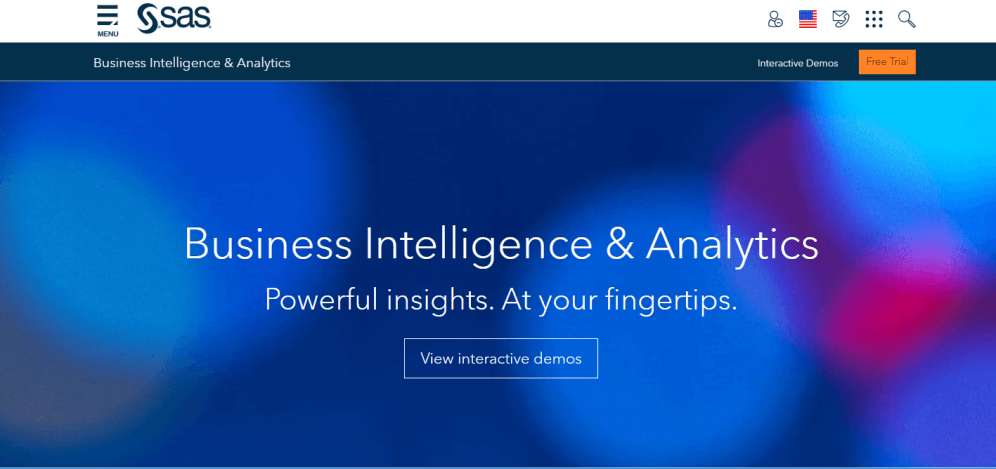
SAS Business Intelligence is a BI tool offering numerous products and technologies for data scientists, text analysts, data engineers, forecasting analysts, econometricians, and optimisation modelers, among others. Founded in the 70s, SAS Business Intelligence enjoys a long tradition in the market, building and expanding its products every year. With a Capterra rating of 4.3 and 4.2 in G2Crowd, this software enjoys a decent level of users’ trust and satisfaction.
KEY FEATURES:
5 main subjects: SAS offers different BI products and technologies that are focused on visual data exploration and easy analytics, interactive reporting and dashboards, collaboration, and mobile apps.
Visual data exploration supported by machine learning: SAS’ data exploration offers automated analysis supported by machine learning compiled in interactive visualisations that answer business questions such as: “Where do my customers come from?”
Text analytics capabilities: Interesting features are text analytics that enables you to gain insights from text data such as social media and location analytics that combines data in a geographical context.
Reports and dashboards across devices: Dynamic visuals are organised into interactive reports and dashboards, similar to other tools in our lists, and you can access them also on mobile and tablet devices (both Android and iOS).
Integration with other applications: You can integrate SAS with Microsoft Office applications such as PowerPoint, Word, SharePoint or Excel with their Office Analytics solution which enables you to view your results directly in Microsoft Office Suite.
SHORTCOMINGS:
Considering the complexity of the product and its offers, the higher price range and limited customisation options can be huge factors in deciding if this business intelligence tool would be the right choice, as most reviewers indicate on Capterra and G2crowd.
3. Infor Birst
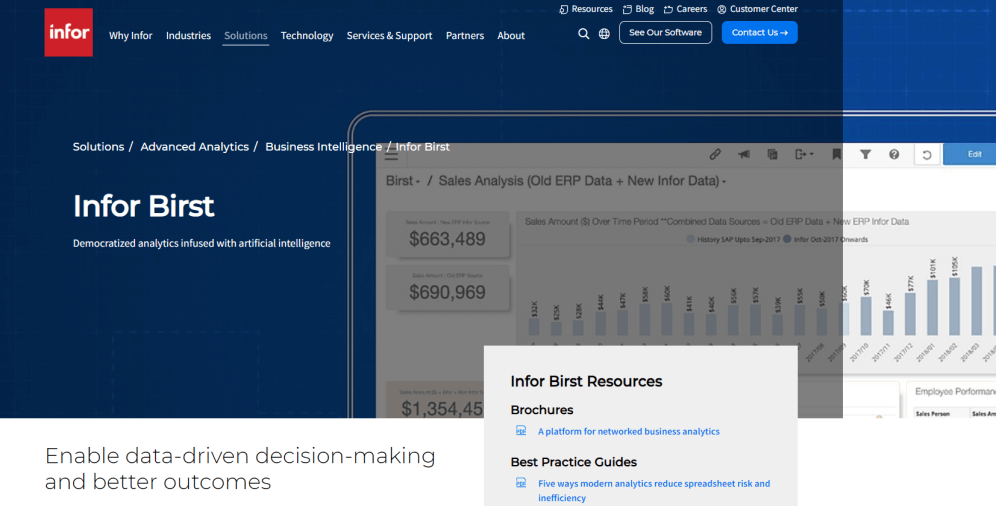
Infor Birst is a cloud-based analytics and business intelligence platform that helps in understanding and optimising complex analysis processes. Infor, a global company with an extensive portfolio of software products for specific industries, acquired Birst in 2017. Today, Infor Birst is an advanced end-to-end solution with a data warehouse, visualisation and reporting platform, and a networked BI approach based on extensive automation and learning technologies. Customers of the BI vendor rated the software with a solid 4.1 stars on Capterra and 3.9 stars on G2Crowd.
KEY FEATURES:
Modern data architecture: Birst's native cloud BI platform is based on Infor's modern data architecture. The advantages of this are high flexibility, data security as well as scalability to adapt to changing business conditions.
Networked BI: Thanks to a multi-tenant cloud architecture, interconnected analytics and BI instances are created based on a common Data-as-a-Service (DaaS) structure.
Adaptive interface: Cross-device access to the platform that meets the needs of modern work styles, enabling a positive user experience with the same interface, whether online or offline.
Embedded BI: Infor Birst's cloud solution gives you the option to integrate it with your own application. This allows you to monetise data in a familiar software environment without having to develop an analytics product yourself.
Industry analytics: Different role and industry-specific data models, as well as analysis options, are offered. With their help, specific trends but also weak signals can be identified in order to react to them at an early stage and increase profitability.
SHORTCOMINGS:
Some customer reviews describe the user interface as confusing in parts. In addition, data integration is more complicated than described, as the business intelligence tool does not create a data model based on the linked data sources in a completely automated way.
4. SAP BusinessObjects
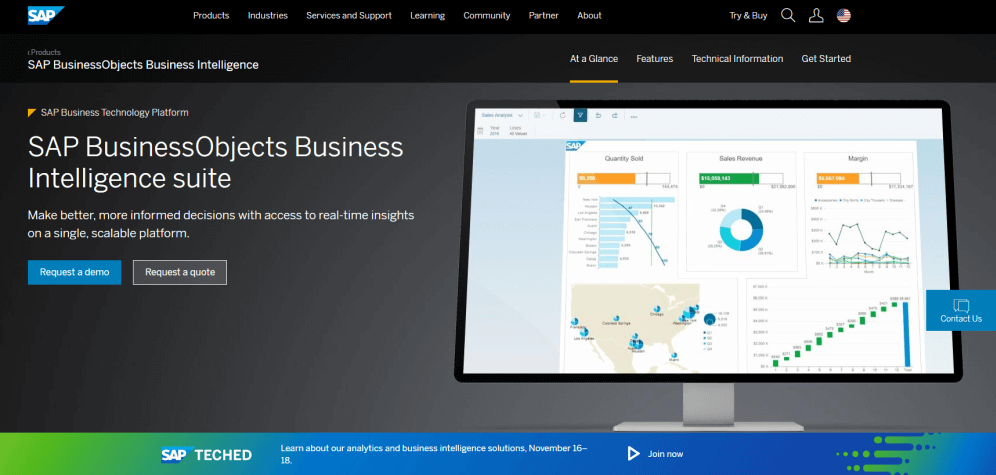
SAP BusinessObjects is a business intelligence platform designed for comprehensive reporting, analysis, and data visualisation. They provide Office integrations with Excel and PowerPoint where you can create live presentations and hybrid analytics that connects to their on-premises and cloud SAP systems. They’re focused on business categories such as CRM and customer experience, ERP and digital core, HR, and people engagement, digital supply chain, and many more. To be accurate, more than 170M users leverage SAP across the world, making it one of the largest software suppliers in the world. On Capterra, the company obtained a review of 4.3 stars, while in G2Crowd, it obtained 3.8 stars with over 200 reviews, confirming its well-established place in the market since 1972.
KEY FEATURES:
A BI enterprise reporting system: Reporting and analysis are done with ad hoc queries and a complex BI enterprise reporting system designed to guide your overall company strategy.
Self-service, role-based dashboards: Analytics applications and data visualisation are focused on self-service capabilities, similar to other tools, where you can build your own role-based dashboards and applications to assess risks, for example.
Cross-enterprise sharing: You can create a cross-enterprise sharing functionality that will enable you to communicate your findings with other stakeholders and partners.
Connection with SAP Warehouse and HANA: Multidimensional data analysis enables you to filter and manipulate data with real-time analytics when you connect with SAP Business Information Warehouse (SAP BW) or SAP HANA.
Integration with Office: By using Microsoft Excel with SAP, you can analyse larger volumes of data, and embed analytics in PowerPoint, making this solution easily integrated with Office.
SHORTCOMINGS:
Some reviews report that extensive analysis functions are rarely usable without additional user training. In addition, the costs for the individual modules are relatively high and there are comparatively few feature updates.
5. Pentaho
Pentaho is an end-to-end data integration and analytics platform from Hitachi Vantara that offers a range of business intelligence capabilities such as OLAP services, reporting, dashboarding, data mining and integration, ETL, and more. With all these functionalities, some of them being presented as open-sourced plugins, the software aims to help businesses manage big amounts of data to positively impact strategic decisions and business results. Pentaho’s BA platform can be used in the cloud or on-premises through two different formats: a community edition with basic features or a more complete enterprise edition which is obtained through an annual subscription. Reviewers gave Pentaho 4.3 stars rating on Capterra and a 4.1 in G2Crowd, earning it a position in our BI tools ranking.
KEY FEATURES:
Cloud data integration: A complex ETL engine that enables you to execute data integration jobs and transformations in and out of big data environments. It supports a wide range of data sources including more than 30 open source and proprietary database platforms.
Data mining: By using a set of machine learning algorithms from the Weka project, you are able to perform efficient data mining tasks using clustering, decision trees, and neural networks, among others. The trends and patterns uncovered in this process can be used for future business decisions.
Pentaho Report Designer: Query data from multiple sources including SQL, MXD, flat files, and more, and generate scheduled or on-demand reports in various formats such as XLS, PDF, TXT, and HTML.
Pentaho Dashboard Designer: A self-service drag-and-drop interface to quickly generate dashboards and scorecards with multiple data visualisation options. With just a few clicks, you are expected to be able to answer multiple business questions by analysing important KPIs.
Advanced analytics: Pentaho also offers a set of advanced analytical capabilities such as predictive analytics technologies to generate accurate forecasts and extract valuable insights, as well as advanced charting options to communicate complex data in a simple way.
SHORTCOMINGS:
Reviewers on Capterra and G2 pointed out that the interface of the tool is not intuitive enough. Non-technical users might find it hard to understand and solve issues as there is not enough documentation to support them.
6. Domo
Domo is a business intelligence software comprised of multiple systems that are featured in this platform, starting with connecting the data and finishing with extending data with pre-built and custom apps from the Domo Appstore. You can also use Domo for your data lakes, warehouses, and ETL tools, alongside R or Python scripts to prepare data for predictive modelling. Similar to other tools, you can connect the data across your enterprise, utilise their machine learning and artificial intelligence capabilities while enabling users to explore the data on their own. With a firm 4.2 stars rating on Capterra and an even better 4.4 in G2Crowd, this BI application is also recommended by many users across the world, even though the company is one of the youngest on our list – founded in 2011.
KEY FEATURES:
Numerous pre-built cloud connectors: Data integration works similarly to other tools, as mentioned; you can connect to more than 1000 pre-built cloud connectors, on-premise with Domo Workbench, file upload such as Excel or Google Docs, proprietary systems, and federated connectors that will enable you to query the data where it’s hosted.
Magic ETL feature: Data transformation tools will enable you to prepare your data with a drag-and-drop Magic ETL, as Domo calls it, without the need to learn SQL.
Automatically suggested visualisations: Data visualisation enables you to go from raw data to charts, graphs, maps, and other visualisation types which are suggested automatically by Domo after you upload your data source. You can refine the data, annotate for further commentary or discussions, or refine and control who has access to it.
Mr. Roboto as an AI engine: Predictive analysis is powered with Mr. Roboto, Domo’s AI engine, which enables data scientists to create predictive models and utilise artificial intelligence, machine learning, natural language processing, and other AI technologies that alert and notify about changes in KPIs, for example.
Domo Appstore: Their open cloud platform is an ecosystem of pre-built apps, connector APIs, and dashboards designed to address specific business needs, giving you also the possibility to build your own and share it on the Domo Appstore.
SHORTCOMINGS:
Domo is not built for newcomers as the learning curve can be steep, but they do offer training, therefore, be prepared to learn. Their pricing models are not transparent, but you can assume it’s the most expensive solution on our list, according to the available information on the web.
7. Oracle Business Intelligence
Oracle Business Intelligence is a portfolio of technology and applications with a focus on providing end-to-end solutions to help businesses optimise their performance and empower them to make faster and more informed mobile-enabled decision-making. Oracle has 4.1 stars rating on Capterra and a 4.0 in G2Crowd, and they offer a wide ray of features for data management such as machine learning, artificial intelligence, an integrated array of querying, reporting, and mobile analytics, among others. Since its foundation in 1977 Oracle’s mission has been to provide businesses with the tools to efficiently manage their data in a comprehensive and agile way.
KEY FEATURES:
Oracle BI Server: The tool offers a complete BI server that provides centralised data access for anyone across the enterprise. The server hosts all data-backed business processes such as dashboards, ad hoc querying, OLAP analysis, data mining, and more.
Ad hoc capabilities Oracle BI Answers: This feature provides true ad hoc capabilities in an intuitive way. With no room for complex processes and preventing runaway queries, users can easily generate charts and visualise their data fast and efficiently.
Oracle BI Dashboards: The tool offers personalised dashboards that provide access to information in an interactive way while being personalised based on an individual’s roles and identity. Like this, users are working with live reports, charts, graphics, and pivot tables in pure web architecture.
Personalised alarms: Oracle BI Delivers is a personalised alarming system that provides businesses with activity monitoring and can reach users via dashboards, emails, or even mobile devices. Alerts can initiate and pass contextual information to other alerts or users for a collaborative workflow.
Oracle BI Publisher: This feature offers the capacity to generate scalable reporting to deliver complex information to stakeholders securely and in the correct format. Reports can be designed using Microsoft Word or Adobe Acrobat and can be delivered via e-mail, printer, fax, WebDAV, or be published in a portal.
Real-time Decision Server: Combining rules with predictive analytics, this feature enables real-time intelligence to be implemented in any business process. The tool provides recommendations and reveals insights in real-time.
SHORTCOMINGS:
According to Capterra and G2Crowd reviewers, the Oracle BI runs slow on some occasions, especially when generating reports. For some functions, such as adding information to data models, complicated and time-consuming processes are reported.
8. INETSOFT STYLE INTELLIGENCE
Next in our list of BI tools, we present Style Intelligence, a web-based BI and data intelligence platform owned by InetSoft. It provides multiple self-service analytics capabilities such as dashboards, visual analytics, and reporting in a secure environment. At its core, Style Intelligence is a data mashup engine that offers flexible data transformation from disparate sources in an uncomplicated way without the need for further warehouse investment. The platform is fully scalable and easy to deploy, and it serves both enterprises and solutions providers as well as technical and non-technical users thanks to its intuitive design. Reviewers gave the tool 4.5-star ratings in both Capterra and G2Crowd.
KEY FEATURES:
Data access and mashup: The data mashup engine can access almost any data source including spreadsheets, relational databases, big data storages, and others, and combine the data in them for future analysis. If a specific source is not available, the user can create a custom data connector.
Mashups in visual dashboards: Mashup users can quickly verify and manipulate data blocks using visually appealing dashboards which can be adapted to a mobile format thanks to the web-based nature of the software.
Style reports: Pixel-perfect reports are also combined with mashup capabilities giving you the possibility to integrate merged data into report documents for online or offline distribution. These reports can be personalised and protected for different use cases and roles.
Self-service analytics: Dashboards and data visualisations can be transformed and edited without the need to write any SQL code. Users can perform ad hoc chart editing, monitor important KPIs, and do complex data mashups with little effort.
OEM-friendly embedding: Like other solutions on this list, Style Intelligence is designed to be embedded into different applications. OEM-friendly functionalities such as white labelling and multi-tenant hosting are available.
SHORTCOMINGS:
Reviewers found that, in general, the learning curve for the software is a bit longer. Additionally, some mention that additional documentation would be useful.
9. Zoho Analytics
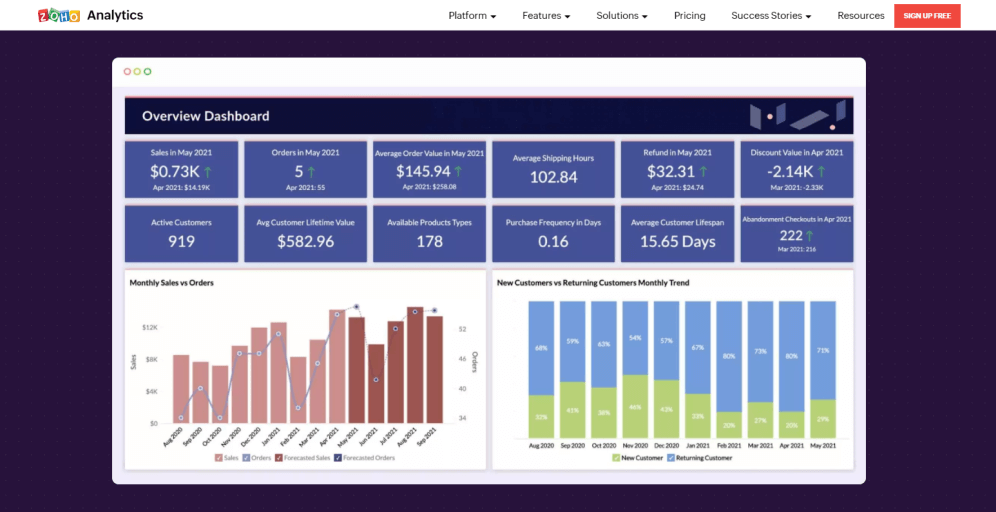
We continue our BI tools list with Zoho Analytics. Although the company offers many products ranging from CRM, bundles, and apps, here we focus on their BI and analytics solutions as the most relevant for our topic. With more than 500 integrations for your business apps, more than 10 000 customers worldwide, and a strong 4.3 stars rating on Capterra and 4.2 on G2Crowd, this is one of the business intelligence reporting tools worth taking into consideration.
KEY FEATURES:
Blending and visualising data: Similar to other tools on our list, their most prominent features focus on blending data from multiple sources, and visualising them through reports and dashboards via their drag-and-drop designer. You can also feed data from their online storage service Zoho Docs.
Data preparation: Use the Zoho DataPrep app within Zoho Analytics for smart and automated data preparation. Data can be cleaned, transformed, enriched, and catalogued for a more efficient analysis process.
Intelligent assistant Zia: If you’re looking for artificial intelligence-powered analytics, Zoho has created Zia, an intelligent assistant to whom you can ask questions in form of natural language, and you will immediately receive the answer in the form of reports and KPI widgets. Zia is based on natural language processing and machine learning technologies to help the user search for data faster.
Commenting section in sharing options: If you opt for a shared view of your reports, you can enable commenting in real-time on elements such as charts, pivot views, tabular views, tables, or dashboards. The people that you collaborate with will be immediately notified and you can develop a complete thread as well as attach files, crop your screen, or use different formatting options.
Geo visualisation: Apart from various visualisation options such as charts, widgets, pivot tables and tabular view components, geo-visualisation is a feature that will enable you to analyse the geographical data with interactive map charts across countries, states, regions, and even latitudes and longitudes.
SHORTCOMINGS:
There are reports that you will need additional development knowledge if you want to utilise more advanced tasks with this business intelligence tool. Additionally, it will take time to get familiar with organising your workflow, and connecting the dots before you can fully take advantage of their features.
10. Dundas BI
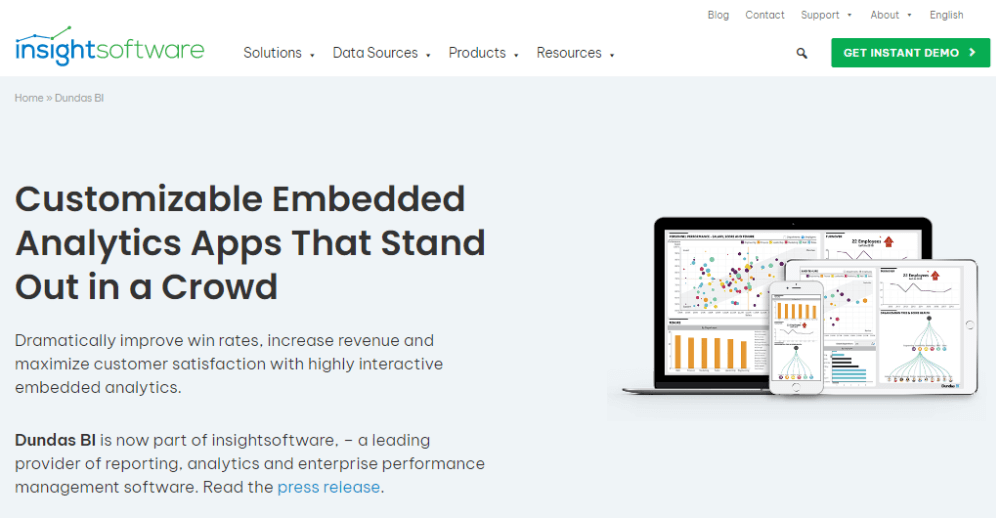
The next tool on this list is Dundas BI, a business intelligence platform that has been in the market since 1992, gaining much recognition over the years. Recently acquired by insightsoftware in August of 2022, the platform’s traditional BI features such as interactive dashboards, reports, visual analysis, and embedding are now complemented by a strong ETL engine and pixel-perfect reporting capabilities with an overall focus on embedding analytics. Loyal users of this tool gave it 4.5 stars in Capterra and 4.4 stars in G2Crowd.
KEY FEATURES:
Personalised embedding analytics: This feature enables you to enrich your existing system and generate new revenue streams by embedding Dundas BI and all its analytical functionalities into it. Thanks to white labelling capabilities, you can make the embedded analytics platform look and feel like your current application.
Customisable data views: The tool allows you to generate dashboards with drag and drop capabilities. Dashboards can be customised with a wide range of charts, styles, and themes with a responsive design.
Seamless integration: Dundas BI is a fully programmable platform that can be customised by regular as well as advanced end-users with CSS styling and full scripting. This means the entire system can be embedded into your own application with an API.
Tailored Analytics: Dundas BI provides real-time data so that business users can view, create, interact, and monitor their data quickly and on any device. Additionally, the tool supports cross-analysis so that users can explore their data and uncover hidden opportunities.
Interactivity: When visualising your data, Dundas BI platform offers highly interactive options such as smart recommendations, chart animated transitions, and data brushing, among others. The final goal is to keep users engaged while helping them understand the data faster.
SHORTCOMINGS:
According to reviews found during our research of Dundas BI, we found that the tool has a slow learning curve and is missing an undo option so that users could go back if they made a mistake. Additionally, reviewers add that more documentation could help them get acquainted with the tool faster.
11. GoodData
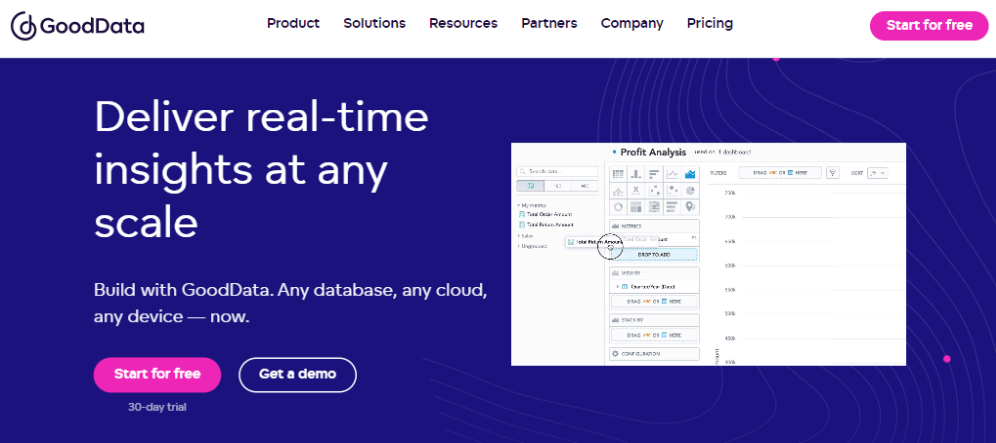
GoodData is a business analytics software that provides tools for data ingestion, storage, analytic queries, visualisations, and application integration. You can embed their analytics into your website, desktop, or mobile application or create dashboards and reports for your daily activities, without the need to obtain a Ph.D., as stated on their website. Also, one of the younger software solutions on our list, founded in 2007, GoodData received a stable 4.3 stars review on Capterra paired with a 4.1 on G2Crowd positioning them as one of the great tools to manage your business.
KEY FEATURES:
Customers can publish their own reports: Embedded analytics can be delivered at scale, for each customer you might have, with a wide range of customisations (custom data models and analytics and custom colours, fonts, and logos) that let customers publish their own reports and dashboards.
A modular data pipeline: They also offer a modular data pipeline for fast data integration with an on-premise or cloud warehouse, no matter if the data is structured, semi-structured or unstructured. You can also use tools such as SQL, Python, R or Ruby for flexible data processing.
A platform for developers: An open platform for developers provides you with frameworks to integrate with the existing data by utilising white-labelled iFrames or their JavaScript library supported by numerous React components.
Augmented analytics: GoodData lets you build custom machine learning and AI capabilities such as natural language querying or chatbots for automated insight generation.
4 Data centres: GoodData has 4 different data centres: two in the USA (Chicago and Dallas) and one in the EU and Canada, although the exact locations in these two regions are not specified. Existing projects can be transferred from one data centre to another at any time.
SHORTCOMINGS:
Some users report it's difficult to use despite completed training sessions and a higher price range for small businesses.
12. IBM Cognos Analytics
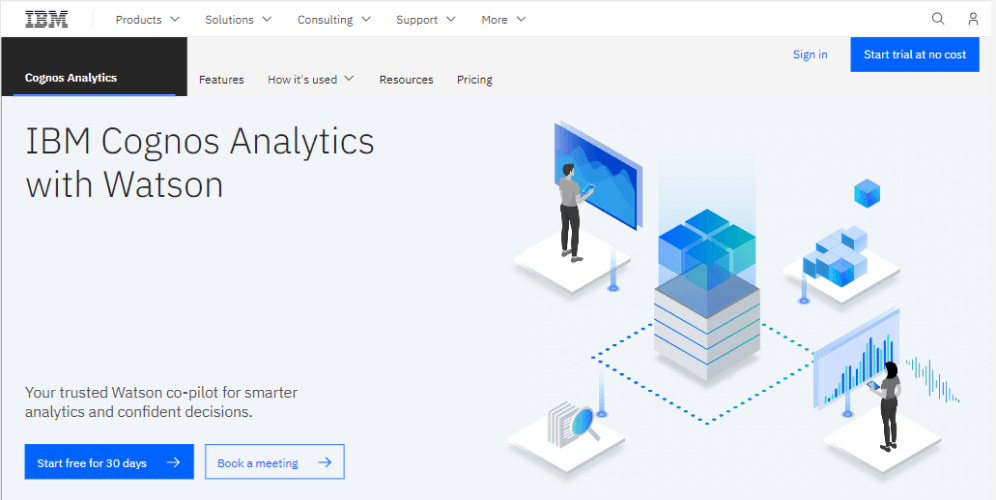
IBM Cognos Analytics is a cloud-based business intelligence software that utilises AI recommendations when creating dashboards and reports, geospatial capabilities to overlay your data with the physical world, and enables you to ask questions in plain English to communicate with the software. A robust solution from one of the industry leaders in software development, IBM Cognos Analytics received a sturdy 4.1 stars review on Capterra paired with 3.9 stars rating on G2Crowd.
KEY FEATURES:
Search mechanism: A new Cognos Analytics search mechanism enables you to discover and access recently used content within the software, where you can filter and save your searches.
A single data module: Multiple data sources are joined into a single data module that doesn’t replace the IT department but allows users to generate and work with insights on their own.
Interactive data visualisation: Interactive visualisations are coupled with embedded geospatial mapping and advanced analytics. Dynamic dashboards can be easily generated via drag and drop.
AI assistant: Enables users to communicate in plain language: simply ask a question, and the assistant will recommend the most suitable visualisations.
Extensive knowledge centre: A comprehensive knowledge centre, community, and support for learning and understanding their product.
SHORTCOMINGS:
It will take a while to get familiar with all the features and capabilities this solution has on offer, and if you look for comprehensive dashboard features, this tool would not be suitable, as many users reported.
13. METABASE
Metabase is an open source BI server that can be easily installed and integrated with multiple data sources including MySQL, PostgreSQL, MongoDB, and more. With no need for extensive technical knowledge, users of the tool are expected to extract useful insights from their data in a secure environment with an intuitive interface. These insights can then be shared with colleagues or other relevant stakeholders in the shape of stunning graphs and dashboards that will enhance the decision-making process and the use of data across the organisation. The software, which offers a free open source version as well as a paid enterprise version, has a positive rating of 4.5 stars in Capterra and 4.4 stars in G2Crowd.
KEY FEATURES:
Visual query building: With no need of dealing with any SQL code, users can easily perform advanced analysis using joins, aggregations, and more. There is also a full editor for more advanced users that want to write their own queries using SQL.
Bring your data to life: As stated on their website, Metabase offers over 15+ built-in visualisations to create powerful dashboards and visualise important analytical findings.
Discoveries sharing: Metabase offers the possibility to share dashboards and reports with relevant players via Slack, email, and more, as well as embed them into different formats such as presentations or webpages.
Secure data access: The ability to set permissions to access the different dashboards and reports in an automated way. The tool also allows to monitor any access and exports of the data by specific users.
SHORTCOMINGS:
According to various reviews, Metabase works slowly when it comes to processing large databases. They also point out the need for some SQL knowledge for better user experience.
14. QLIKSENSE
Qlik Sense is one of the BI applications offered by Qlik as part of its data analytics platform focused on rapid development and guided cloud analytics applications and dashboards. The tool offers a range of augmented analytics functions ranging from data visualisations, dashboards, reporting, embedding analytics, natural language analysis, and more, with the aim of empowering people of all skill levels to use data to make meaningful decisions. With a positive rating of 4.4 stars on Capterra and 4.5 stars on G2Crowd, users are quite satisfied with this product and its features, making it one of the top BI tools on our list.
KEY FEATURES:
Associative exploration: This feature is based on simple selection and search functions that can be entered by end-users to uncover connections between data sets. As you click, the selected data will turn green, the associated data will turn white, and the excluded data will turn grey, making it easier to extract hidden insights.
Self-service data visualisation: The software enables you to easily combine, load, visualise and explore your data no matter the size. The broad library of graphs, charts, and visuals can be manipulated to answer any question that arises ad hoc.
Insight Advisor Chat: Thanks to natural language processing (NLP), you can ask analysis and discovery questions to the Insight Advisor in Qlik Sense. The NLP tool will analyse user intent and the answers will be instantly displayed in the shape of visual and narrative insights.
Qlik Sense Apps: These are task-specific applications that are created on Qlik Sense’s cloud hub to answer specific questions. The apps contain one or more sheets of important data that is interpreted with visualisations. Apps can be securely shared with other users on the cloud hub for a more collaborative analysis.
A dual-use strategy: Qlik offers its customers the ability to extend Qlik Sense with other products from their portfolio, enabling the development of individual dual-use strategies.
SHORTCOMINGS:
You will need to be willing to learn to utilise this software as it requires technical expertise at many points, and small to midsize companies might find it quite pricey.
15. Board
Last but not least in our list of business intelligence tools we have Board. Rated with 4.5 stars in Capterra and 4.4 in G2Crowd, Board is a Swiss BI tool that was founded in 1994 as a platform for decision-making, business planning, and performance tracking. Board offers an intuitive data analytics solution to build interactive dashboards, run effective analyses, and generate impactful reports all by combining a self-service approach with enterprise-wide data governance.
KEY FEATURES:
HBMP: Board platform is based on a proprietary in-memory technology called Hybrid Bitwise Memory Patter (HBMP). This combines outstanding performance with full read and write capabilities that make processes such as data visualisation, simulation and planning faster than ever.
Calculated metrics: Generate calculated metrics such as Excel formulas and immediately use them in analysis, reports, or dashboards. Additionally, the tool offers time-based functions to perform cross-analysis or historical analysis easily on your dashboards.
Simulation: The tool allows you to generate what-if and what-for scenarios, making it easy to compare and simulate different outcomes in the data. This enables users to plan strategies and manage their businesses accurately.
Enhanced workflow: Board offers integrated workflow management with options such as conditional alerting and mailing, cell locking, and triggered events, among others.
Reverse algorithm: This algorithm enables you to make changes across dimensions and hierarchies to the calculated fields. For example, if you make a change in a percentage, the change will automatically reflect in the quantities that were used to calculate it.
SHORTCOMINGS:
The reviewers point out that installing and updating add-ons is complicated. Also, the documentation provided for the software should be improved, otherwise some functions might be used incorrectly.
Conclusion & Guidance
Big data is all around us and it is steadily increasing with each year. By utilising BI and business analytics tools, you stand to reap great rewards – your data management will become more cohesive, stable, agile, and predictable with the numerous features that these tools have on offer. We aimed to help you consider the best tools on the market, and we hope we have provided an extensive review of each product that will inspire you to start exploring business intelligence tools and find a perfect fit for your company or department.
To help you process and remember all the information you just received, below we provide you with a visual summary of our 15 best business intelligence tools for 2023.
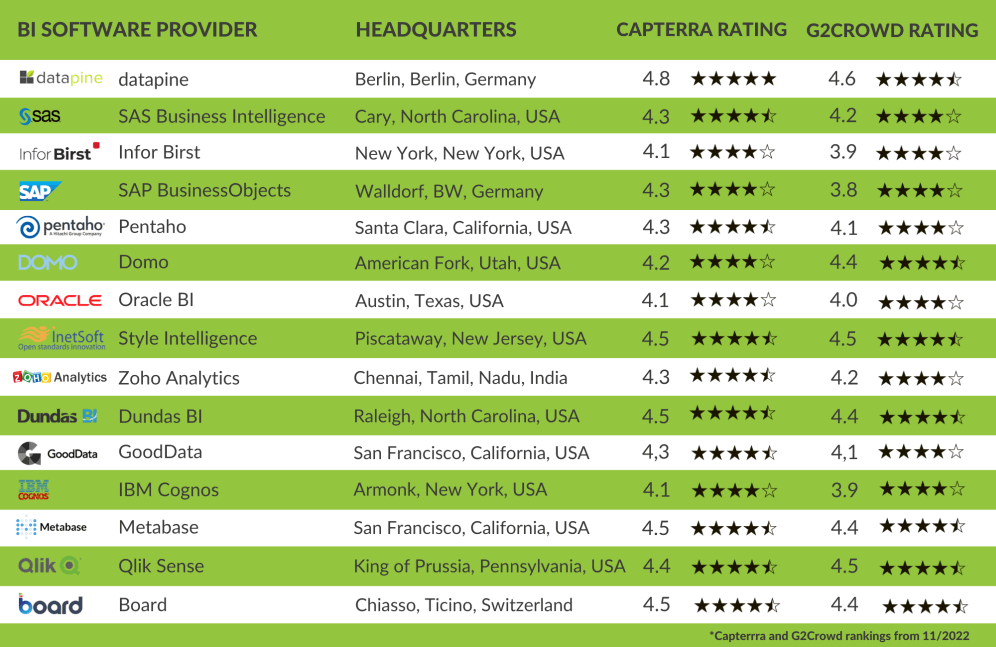
- Summary of the best BI tools for 2023 with customer ratings -
If you want to start your analytics journey with a modern BI platform, which covers nearly all of the discussed product functions in this article, you can test datapine 14 days free of charge and with full functionality.
Take advantage of datapine's modern business intelligence software today!