
KPI Examples for the Healthcare Industry
Healthcare Key Performance Indicators and Metrics
✔ See different templates & designs ✔ Find & track the right healthcare KPIs to meet your corporate objectives
A healthcare KPI or metric is a well-defined performance measurement that is used to monitor, analyse and optimise all relevant healthcare processes to increase patient satisfaction. Many of these metrics are actually specific key performance indicators for hospitals.
Today, healthcare professionals are not only scientifically and patient-driven, but they need to focus on the management of a whole data spectrum on how to provide the best possible care, ensure sustainable hospital performance and effectively manage costs. That’s why creating a professional healthcare dashboard will help managers to optimise these processes and deliver considerable value for both hospitals and patients. To be able to succeed, professionals need the right tools, the right healthcare analytics tools, and, most importantly, the right metrics to track. When all these elements are consolidated and structured, generating comprehensive healthcare reports is the final stage of increasing efficiency.
Here is the complete list of the 19 most important healthcare KPIs and metrics that healthcare managers and professionals need to know:
Average Hospital Stay: Evaluate the amount of time patients are staying
Bed Occupancy Rate: Monitor the availability of hospital beds
Medical Equipment Utilisation: Track the utilisation of your equipment
Patient Drug Cost Per Stay: Improve cost management of medications
Treatment Costs: Calculate how much a patient costs to your facility
Operating Cash Flow: Monitor the financial health of your facility
Net Profit Margin: Ensure your facility remains profitable
Patient Room Turnover Rate: Balance the turnover with speed and quality
Patient Follow-up Rate: Measure the care for your patients over time
Hospital Readmission Rates: Track how many patients are coming back
Patient Wait Time: Monitor waiting times to increase patient satisfaction
Patient Satisfaction: Analyse patient satisfaction in detail
Claims Denial Rate: Ensure medical costs are covered
Treatment Error Rate: Make sure you provide the right treatment
Patient Mortality Rate: Prevent patient mortality under your care
Staff-to-Patient Ratio: Ensure you have enough staff to care for patients
Cancelled/missed appointments: Keep track of patients’ appointments
Patient Safety: Prevent incidents happening in your facility
ER Wait Time: Identify rush hours in your emergency room
Costs by Payer: Understand the type of health insurance of your patients
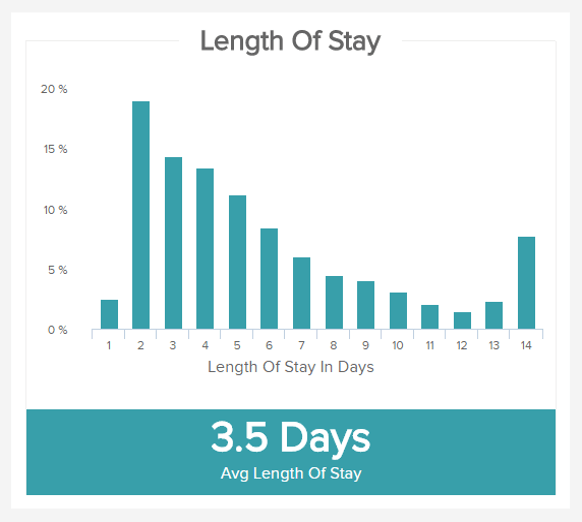
Average Hospital Stay
Evaluate the amount of time your patients stayThe average length of stay in hospital is a pretty straight-forward KPI, as it measures the time spent, on average, by a patient accepted in the facility. This healthcare metric is a very general one and can vary according to the type of stay it measures: a heart transplant surgery will increase the figure while a wisdom teeth removal will do the opposite. This is why it is interesting to breakdown this KPI in different categories of stay, procedures, and operations, so as to have a more accurate result. You can also measure it depending on the different units of your hospital.
Performance IndicatorsAfter different evaluations over this KPI, you may set a target length of stay (accordingly to the type of stay and procedure) that you would like to achieve.
Relevant Showcase Dashboard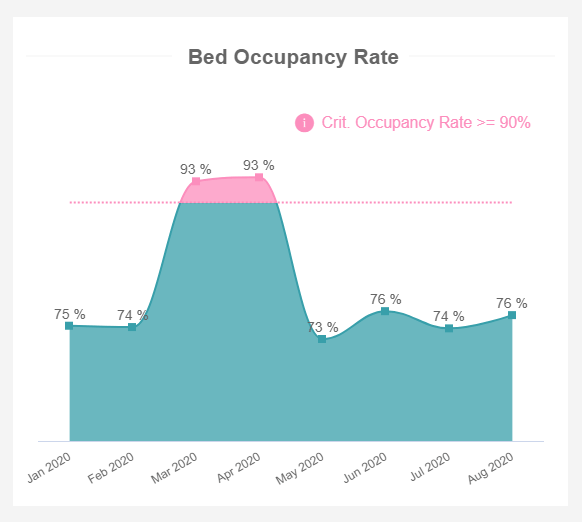
Bed Occupancy Rate
Monitor the availability of hospital bedsOur list of key performance indicators in healthcare wouldn’t be complete without the bed occupancy rate. It’s an important element of analytics, and it quickly shows how many beds were occupied during a specific period, expressed in percentage. In the visual example, you can immediately observe 2 critical months, March and April, when the occupancy was above the critical threshold of 90%. Luckily, the next month brought positive change and the occupancy went down. Higher occupancies could mean a number of things such as a pandemic but the goal is to keep the occupancy under control, otherwise, there are risks of extreme facility pressure and higher numbers of infection.
Performance IndicatorsMonitor the occupancy rate in order to establish a healthy balance between the utilisation of hospital resources and general pressure on the facility.
Relevant Showcase Dashboard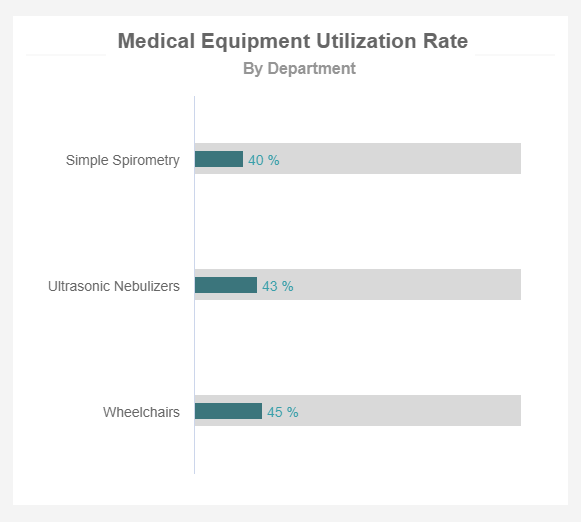
Medical Equipment Utilisation
Track the utilisation of your medical equipmentTechnological advancements and more treatment options for patients mean higher numbers of medical equipment available. This could lead to increased costs of maintenance, wrong purchasing decisions, or lower quality of patient care. That’s why hospital key performance indicators such as the equipment utilisation rate are critical in establishing better asset management processes. Turning to modern dashboard software that created the example on the left will enable hospital leaders to effectively allocate necessary resources and ensure that the equipment is used for optimal needs. For example, reallocate the spirometer from the area of low utilisation rate to the area of higher utilisation as the usage fluctuates.
Performance IndicatorsTrack the equipment utilisation to identify where there’s room for improvement such as reallocation of equipment to other areas where is needed the most.
Relevant Showcase Dashboard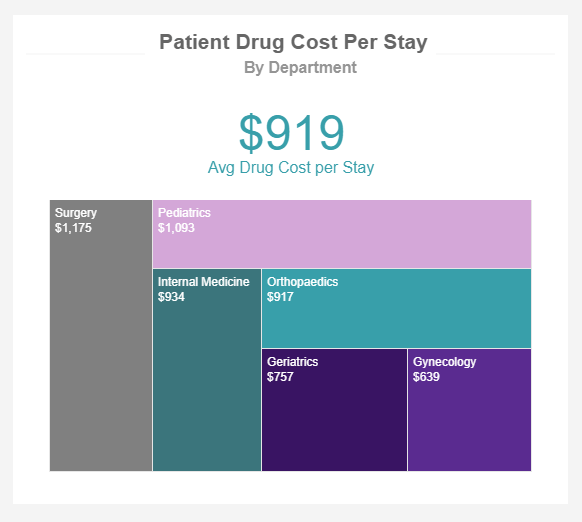
Patient Drug Cost Per Stay
Improve cost management of medicationsAccess to patients’ drugs as well as costs is one of the major elements in hospital management, but also healthcare systems as a whole. If the facility is not able to provide relevant medications, patient care will suffer, hospitals will experience budget pressures, and, consequently, a shortage of staff due to budget cuts. That said, this is a medical KPI that needs special attention and continuous monitoring. Our example shows relevant departments and the average cost per stay, where surgery and paediatrics lead with over $1000, and internal medicine and orthopaedics follow. These insights can help to evaluate future budget allocations, if you expect higher numbers of surgeries, it makes sense to order relevant medications.
Performance IndicatorsMonitor the average drug cost per stay as well on the departmental level in order to effectively allocate monetary resources.
Relevant Showcase Dashboard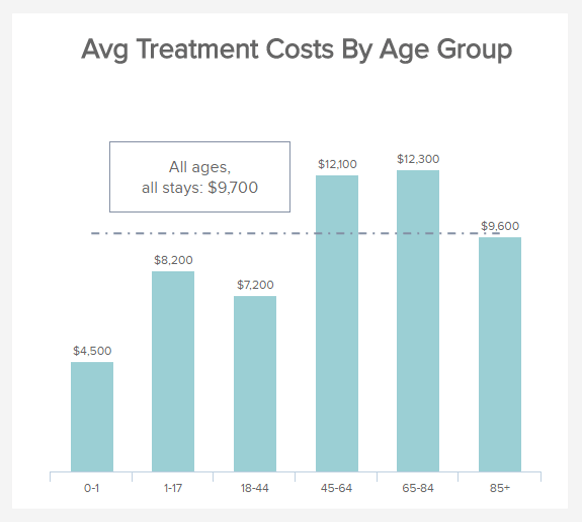
Treatment Costs
Calculate how much a patient costs to your facilityThis a typical healthcare KPI example for monetary management. Treatment costs are important metrics to track as they directly impact your finances, the contribution margin you make, and the capacity of your facility to sustain itself. The purpose is not to reduce it as much as possible to make a profit, but to spot abnormal or exaggerated expenses and address them. You can break it down into various categories -per units, per operations, or as in our example, per age groups. By acknowledging these costs, you can also budget better and allow the right amount of money to go to the right category: a 25-year-old patient costs on average less than a 72-year-old one.
Performance IndicatorsCalculate the treatment costs according to different categories over time and analyse the evolution.
Relevant Showcase Dashboard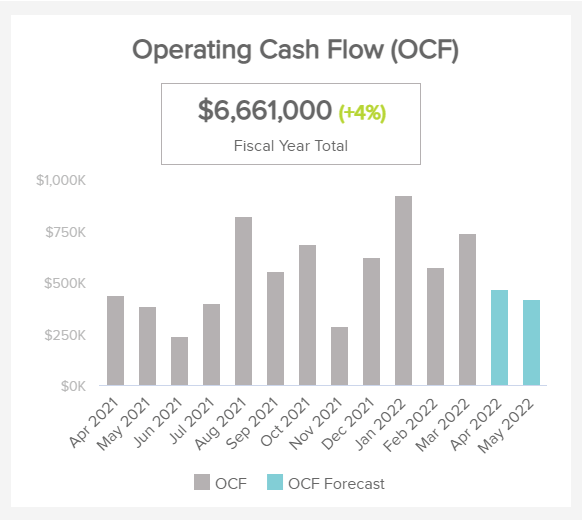
Operating Cash Flow
Monitor the financial health of your facilityMoving on with our list of healthcare metrics we have one from the financial area. The operating cash flow measures the amount of cash generated by a facility’s normal operations. It doesn’t include expenses, revenue drawn from investments, or any other long-term expenditures as it is just focused on core operations. The formula to calculate the OFC is: Operating Cash Flow = EBIT + Depreciation – Taxes – Change in Working Capital. It is a critical metric to track as it indicates whether a company can generate enough cash to sustain its current operations and potential growth. The operating cash flow is often measured as positive or negative. A negative OFC means the facility might need to find temporary sources of funding to be able to pay its staff or buy all the medical supplies it needs to function.
Performance IndicatorsTime is a critical factor when it comes to the OFC. If you see that you have a negative cash flow, you need to respond quickly and find improvement opportunities to ensure business continuity.
Relevant Showcase Dashboard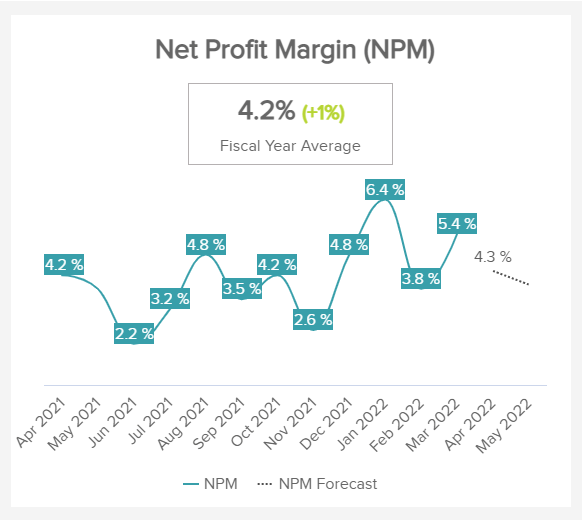
Net Profit Margin
Ensure your facility remains profitableMoving on with another financial metric we have the net profit margin. It essentially tells you how much money the organisation has after subtracting all the expenses (medical supplies, labour costs, payrolls, lease payments, taxes, among others) from the total revenue and it is calculated with the following formula: Net Profit Margin = (Net Income / Revenue) x 100. Just like we saw with the operating cash flow, the NPM is also measured as negative or positive. Naturally, it is important to always keep this number positive, as a negative NPM means the hospital spent more money operating than what is able to recuperate from its operations.
Performance IndicatorsA good way to ensure a positive net profit margin is to reduce unnecessary costs and explore new revenue streams. For example, many health organisations started providing online consultations during COVID-19 which provided a new income source.
Relevant Showcase Dashboard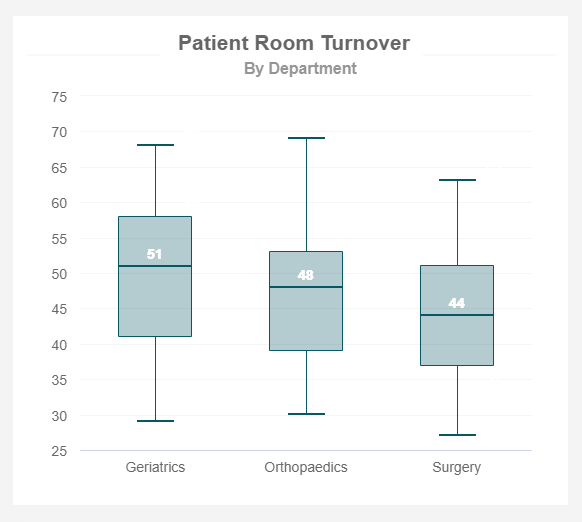
Patient Room Turnover Rate
Balance the turnover with speed and qualityIn order to improve the operational efficiency of your hospital, the room turnover rate is one of the hospital metrics that have to be taken into account. When the patient leaves the room, activities such as cleaning, evaluating the equipment, preparing the room for another patient to enter, and changing medical materials all fall under the turnover. The goal is to create a speedy process but ensure quality. This is important as lower quality can cause higher risks of infections and affect numerous other metrics such as costs. To improve the turnover rate, establish a reliable cleaning service, whether in-house or external, that is also sensitive to patient safety and other hospital regulations.
Performance IndicatorsTo improve the room turnover rate, include high-quality standards of cleaning services, and introduce a tracking system to know which beds are available.
Relevant Showcase Dashboard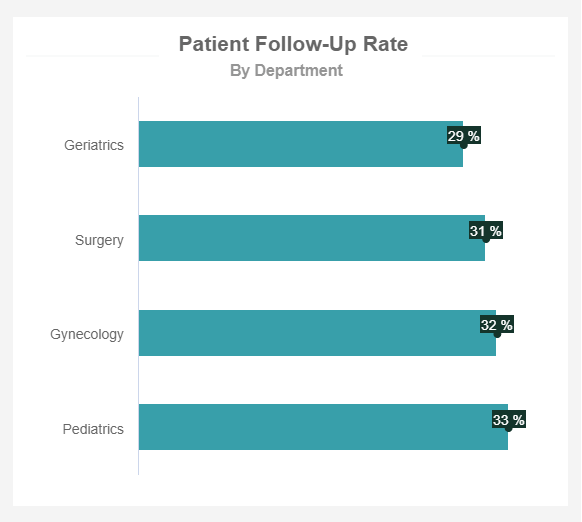
Patient Follow-up Rate
Measure the care for your patients over timeThe patient follow-up rate is one of the healthcare performance metrics that deal with patients’ care after finishing a particular treatment. Treatments include simple check-ups, physical exams, a new prescription, blood tests, or consultations, among others. The follow-up can be done by a physician, nurse, or administrator, e.g., depending on the type of need. For example, a follow-up on cancer patients has its purpose to see if the disease returned or spread across the body so it might make sense to track follow-ups by the department to see what kind of needs patients have regarding the type of treatment (surgery, gynaecological issues or paediatric follow-ups). That way, the hospital has a better overview of particular departmental performance and, consequently, improves patient outcomes.
Performance IndicatorsTo successfully guide patients through their recovery process, monitor the follow-up rates by departments, and see what kind of care patients need the most.
Relevant Showcase Dashboard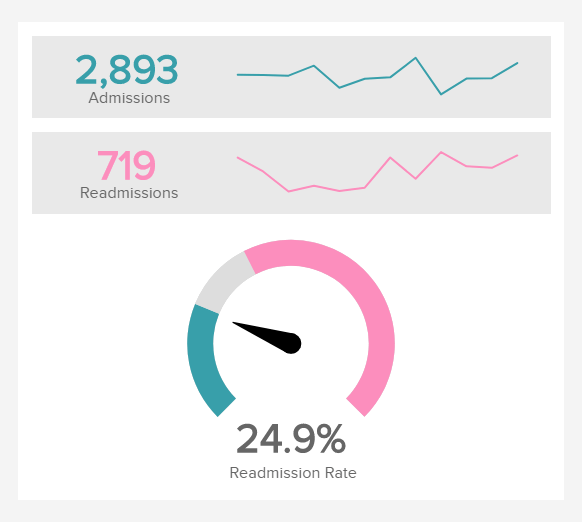
Hospital Readmission Rates
Learn how many patients are coming backA typical healthcare KPI example here. The hospital readmission rate provides information on the number of patients that return to the hospital within a short period of time after being released. It is one of the most important healthcare metrics as it provides great insight into the quality of care administered in the facility concerned — but cannot be used as a stand-alone quality indicator. Readmission rates can also shed the light on other flaws the hospital management is subjected to (lack of staff or appropriate material, overloaded staff neglecting details, units with special need …), and may help in better cost control as it aims to decrease expensive and unnecessary readmissions.
Performance IndicatorsThe lowest your readmission rate is, the better. High readmissions point out dysfunctionalities that must be addressed as soon as possible.
Relevant Showcase Dashboard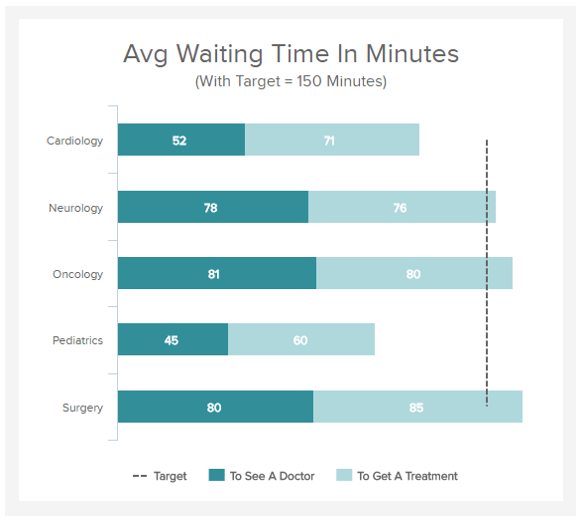
Patient Wait Time
Decrease patients’ waiting timePatient wait time is one of the most important aspects of patient contentment. It measures the time it takes for anyone visiting your hospital from when they register to when they see a doctor and get treatment. It can be particularly interesting to measure it in ER (emergency rooms) to evaluate how prompt the hospital to deliver urgent services to its patients is. This healthcare metric is highly linked to the patient satisfaction score, as no one really enjoys staying hours in a hospital. It can also reveal some other problems your facility is facing, if the figure is too high, and that needs to be addressed.
Performance IndicatorsThe lower the wait time is the better. Measuring this type of healthcare KPI permanently is also important so as to identify trends and rush hours on a longer period, and eventually adjust staffing needs for more efficient patient management.
Relevant Showcase Dashboard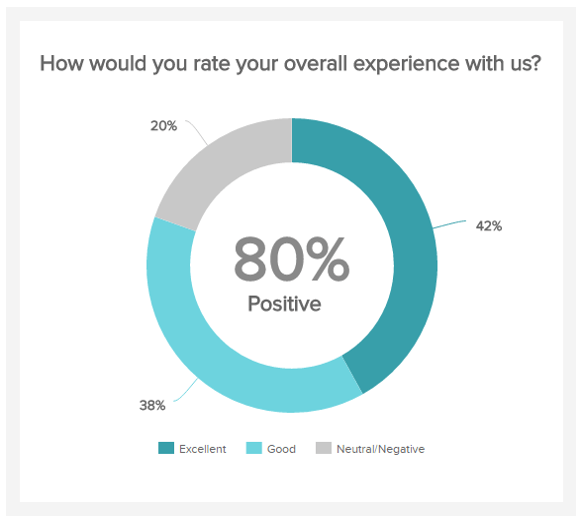
Patient Satisfaction
The showcase of your healthcare facilityThis is another great healthcare KPI example that should be a top priority for any healthcare organisation, in order to have feedback and improve the service. You can ask your patients how they felt while being taken care of, how they would grade their meals, or how long it took doctors and nurses to explain their situation. Such assessment will provide you insights on the overall perception of your hospital services and show you which points can be improved. Besides, your patients will feel listened to as their opinion and feelings are taken into account, which is another important component of the satisfaction score.
Performance IndicatorsThe overall patient satisfaction is precisely the healthcare KPI that will attract or on the contrary scare away future patients. The higher it grows, the better it is.
Relevant Showcase Dashboard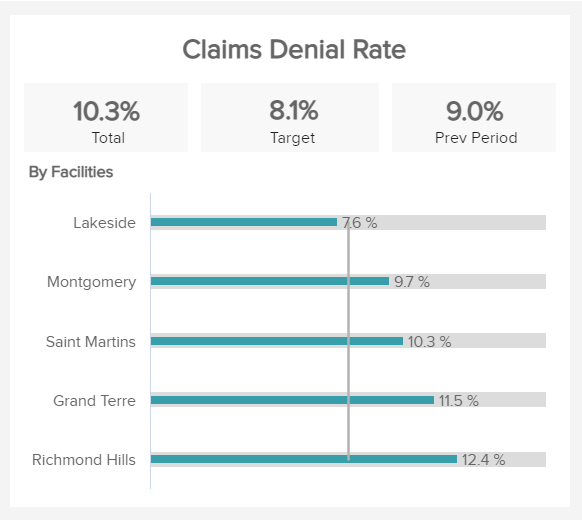
Claims Denial Rate
Ensure medical costs are coveredThe claims denial rate shows the number of times an insurance provider decides not to pay for health costs. An industry standard for the claims denial rate is around 5%. However, since the pandemic strike, health facilities have struggled to keep it under 10%. Some of the most common denial reasons include missing or incorrect patient demographic information, duplicate claim submissions, and services not covered by the payer, among others. Many of these common denial claims are easily avoidable by leveraging technologies such as predictive analytics to identify common causes and implement preventive measures. Having a low claims denial percentage allows organisations to focus on care instead of administrative tasks.
Performance IndicatorsIt is important to keep your claim denial as low as possible as it directly affects your patient satisfaction levels as well as the quality and accessibility of care.
Relevant Showcase Dashboard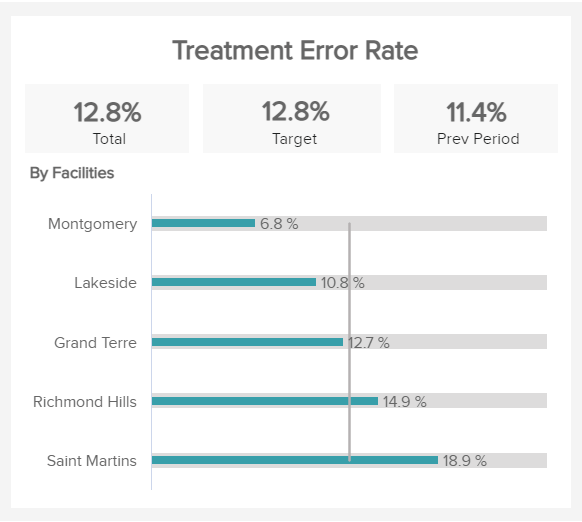
Treatment Error Rate
Ensure you provide the right treatmentNext on our list of insightful healthcare KPIs, we have the treatment error rate. This indicator measures the number of mistakes made by the clinical staff when providing treatment and it is calculated with the following formula: (Number of Treatment Errors / Total Treatments) * 100. Common errors that can be considered in this calculation include prescribing the wrong medication or dosage, diagnosing the wrong disease, and providing the wrong treatment, just to name a few. It is important to monitor this metric carefully as it directly affects patient satisfaction. And not just that, a high treatment error can also lead to an increase in costs from unnecessary readmissions.
Performance IndicatorsTake the analysis one step further by looking at the common errors in each facility. This will allow you to implement preventive measures and lower them. Encourage your staff to report errors as a training opportunity instead of a potential punishment.
Relevant Showcase Dashboard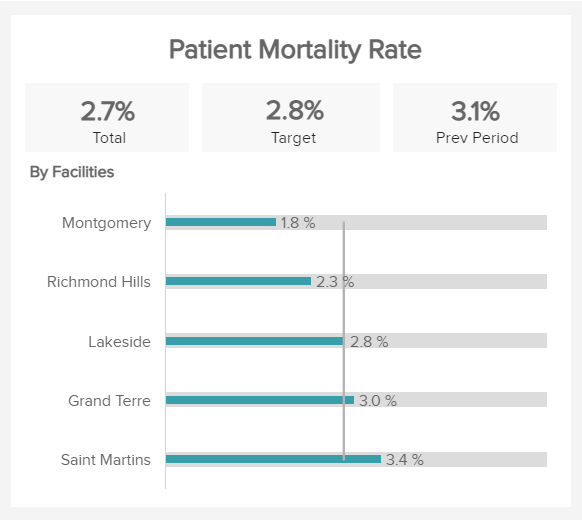
Patient Mortality Rate
Prevent patient mortality under your careArguably one of the most important KPIs in healthcare, the patient mortality tracks the number of people who died while being admitted to a health facility. This indicator is critical as it tells you how capable your facility and staff are at stabilising a patient in critical condition or following operations or procedures. According to the CDC, the average mortality rate in hospitals is around 2%. That said, health facilities should always aim at keeping it as low as possible. A good way to measure this metric is to divide them by category. Naturally, older patients or others with complicated diseases such as cancer have more possibilities of passing away than others with more treatable conditions.
Performance IndicatorsIn order to keep your mortality values below the average, you can set up risk scores for the different patient categories and apply preventive measures for each of them.
Relevant Showcase Dashboard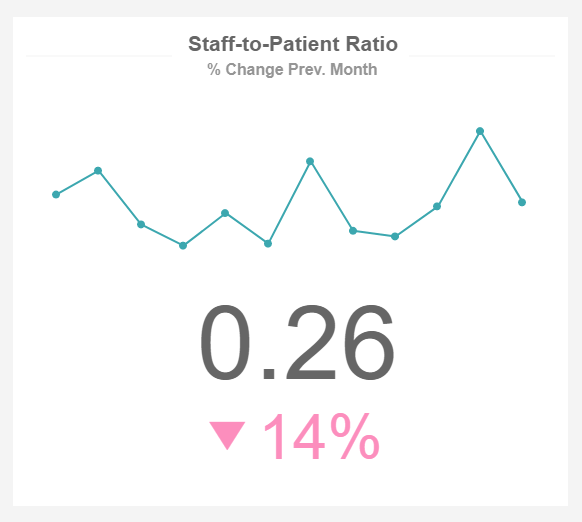
Staff-to-Patient Ratio
Ensure you have enough staff to care for patientsThe staff-to-patient ratio indicates whether your staff management processes are effective, meaning whether the hospital is understaffed or overstaffed. Personnel must be available to provide care to all patients, no matter the time of the day, and immediately, if issues arise. Different states have different regulations, but the goal is to provide optimal treatment and ensure each patient is taken care of when needed. In our example, we can see that a change occurred, in comparison to the previous month, and the staff-to-patient ratio reduced by 14%. Here it would make sense to investigate why and if this drop has caused bottlenecks.
Performance IndicatorsEvaluate your staff-to-patient ratio on a regular basis so that you avoid staff fatigue, increase patient satisfaction, and reduce potential errors.
Relevant Showcase DashboardBecome a data wizard in less than 1 hour!
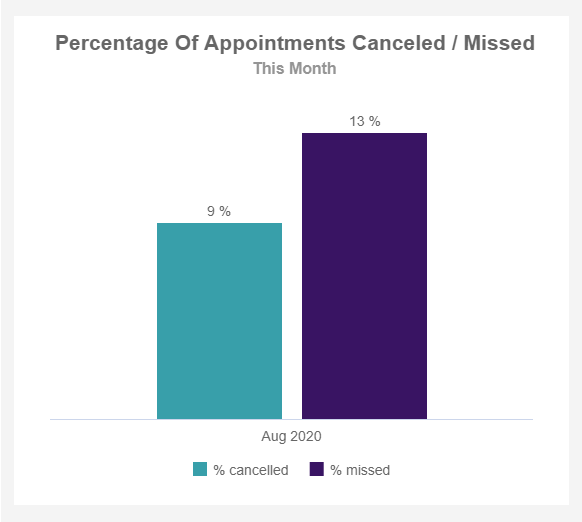
Cancelled/missed appointments
Keep track of patients’ appointmentsThis is one of the important key performance indicators for outpatient clinics as well as hospitals, because it directly affects the efficiency of clinicians. If someone doesn’t attend the scheduled appointment, the result is a waste of resources but also the relationship with the physician suffers since one of the consequences includes a violation of trust. Cancelled appointments are also affecting the facility’s performance, but, in this case, if cancelled promptly, doctors and nurses have the chance to rearrange the schedule and bring another patient in. Forgetfulness, unable to get time off work/school, sickness, transportation issues, and many other factors can influence this metric so you should keep in mind the causes that increase the percentage of cancelled or missed appointments.
Performance IndicatorsMeasure this value for longer periods so you can address the issues and improve the attendance via reminders or additional calls to patients, for example.
Relevant Showcase Dashboard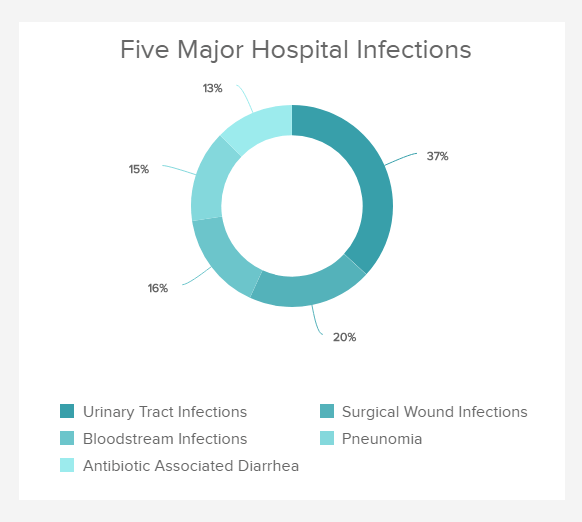
Patient Safety
Identify the incidents happening in your facilityThe patient safety measures the capacity of a care facility to deliver quality care to its patients and keeping them safe from contracting a new infection, post-operation complications, or any kind of sepsis. It is extremely important to track this metric assiduously to know where problems occur, which stage of the process can be improved, and identify any infection abnormally present in your organisation. You can measure this metric and break it down into distinct categories (post-operation infections, respiratory infections, or treatment-related diseases), to have an even more accurate view of your development in the matter.
Performance IndicatorsThis healthcare KPI provides data on the quality of care your hospital delivers. It will give you insights on what must be improved in the different services.
Relevant Showcase Dashboard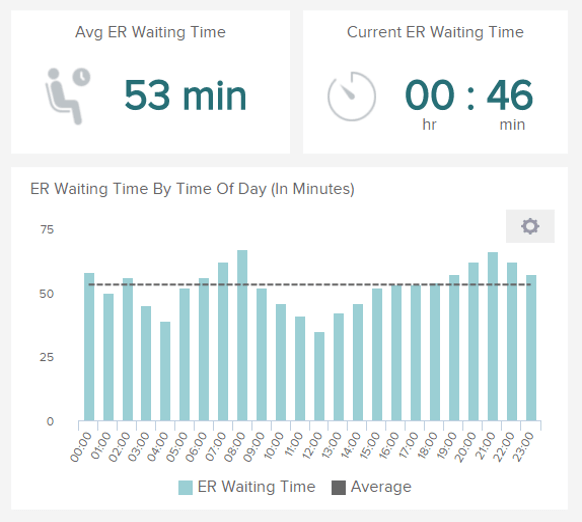
EMERGENCY ROOM (ER) WAIT TIME
Evaluate the time patients spend in the ERER or emergency room wait time measures the amount of time between the arrival of a patient in the ER and the moment he or she can see a physician. This number is linked to the average patient wait time, but is more specific as it focuses on the emergency room only. Evaluate this KPI so as to know when the rush hours of the day are and the busiest days of the week, how long are your patients currently waiting and set a target accordingly. Just like for the patient wait time, it may spark light on issues (staff overloaded, check-in processes needing change, ER facilities congested) the service is facing and that can become very problematic if not solved.
Performance IndicatorsAfter assessment of the ER wait time on average, you should keep an eye on the evolution of that metric and monitor it over time to see trends, so as to adjust or solve any issue popping up.
Relevant Showcase Dashboard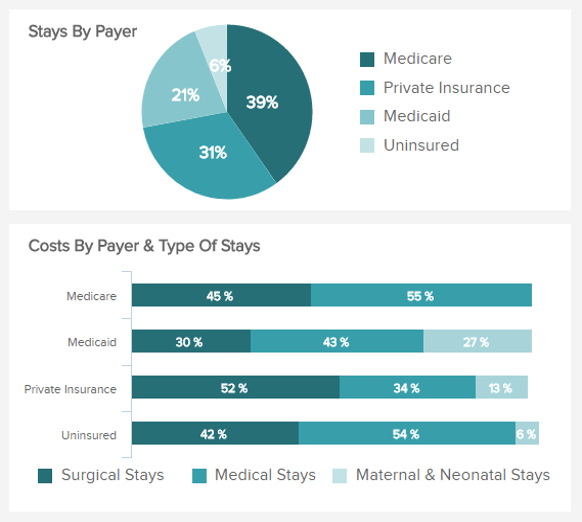
Costs by Payer
Identify the biggest payers for your facilityThis healthcare metric will evaluate the distribution of the costs amongst the different organisms. Whether your patients are under Medicare, Medicaid, whether they subscribe to private insurance or do not have any insurance at all, this metric will help you know which organisms are the biggest payers for your health facility. This will also tell you what types of stay and how much they represent for each healthcare provider: surgical, medical, maternal, and neonatal stay. According to the insurance and the type of stay, the average amount of time they take to pay varies, and knowing how much they represent will help you manage better the financial management of your healthcare facility.
Performance IndicatorsA good assessment of the healthcare providers that are covering your patients is important to track their satisfaction levels.
Relevant Showcase Dashboard


Setup only takes a few minutes. No credit card required!