Analytics, BI Dashboards & Reports for Heroku
Explore, Visualise & Communicate Heroku Data With Style
TAKE ADVANTAGE OF OUR POWERFUL HEROKU CONNECTOR
CONNECT YOUR HEROKU DATA WITH A FEW CLICKS
Heroku is a platform as a service (PaaS) with integrated data services and a powerful ecosystem for running and deploying modern apps. It supports several programming languages like Scala, Java, Python or PHP and is hence said to be polyglot platform: a developer can build, run and scale applications across all the languages.
With datapine’s Heroku connector, join your Heroku SQL database to our BI tool and unleash its full potential to gain insights and make better informed decisions. Work with real-time data to build customised Heroku dashboards visualising the right metrics, and bring your decision-making to the next level.
DYNAMIC & INTERACTIVE DASHBOARDING WITH OUR HEROKU DASHBOARD BUILDER

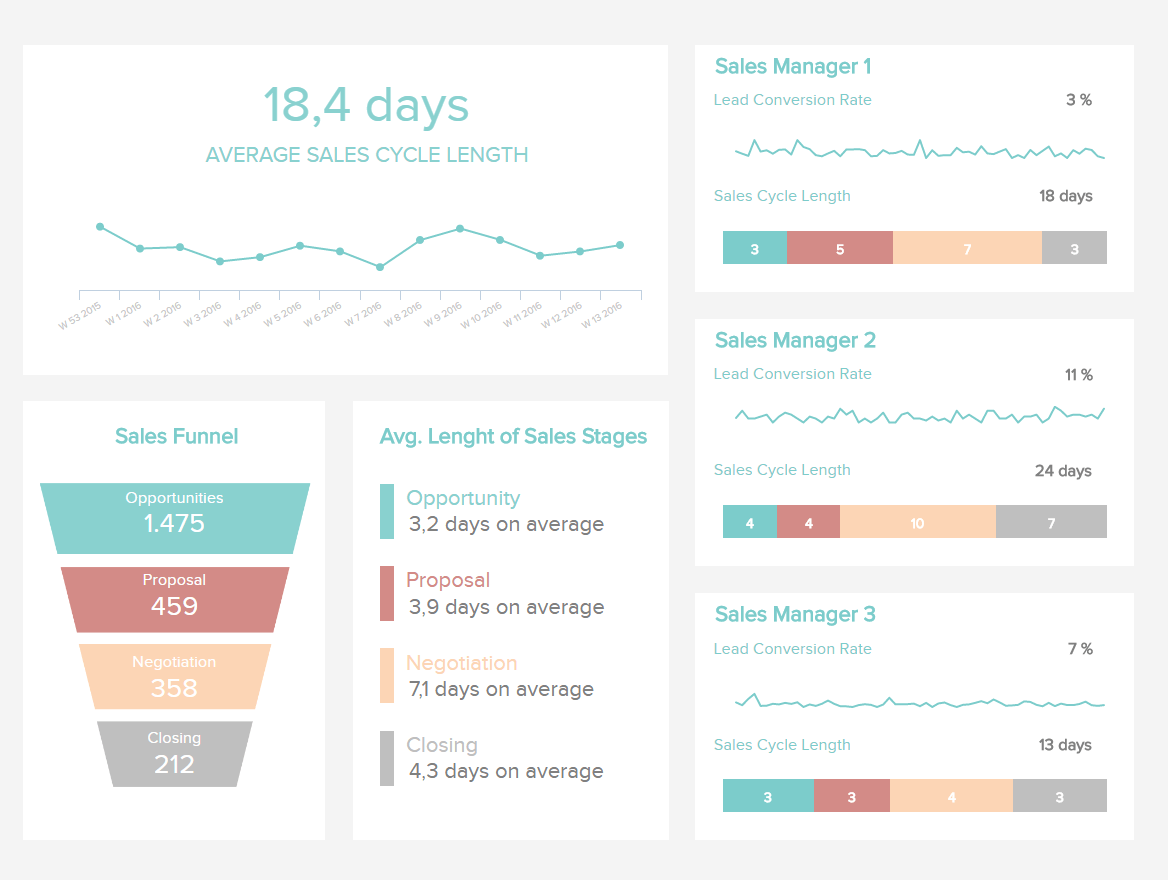
Easily set up your Heroku database and connect your data to our highly secure servers in a few clicks. Simplify the complex rows of data and combine them with tables from other databases that you have also connected to datapine, for a broader and deeper analysis. Perform your cross-database analysis to glean hidden insights that will leverage your information the best way possible. From there, you can then build a compelling Heroku dashboard that gathers all you need to know under one monitoring panel. Our online dashboard creator features extensive styling elements that let you personalise your charts and graphs to your specific requirements. You can add graphs, textboxes, images, frames and lines and create the design that you like; arrange and resize them easily at any moment, if new metrics have to be tracked and added to your Heroku dashboard. You can also apply global style options that will be implemented on every part of your dashboard, for a more harmonious general outlook with just one click. Finally, you can use global time filters that let your users drill-down on the data effortlessly, and look into the precise information they want to see. It is important to have a well-designed dashboard in order to save time, but also to help users to quickly grasp the state of the business and identify the information that matters. With datapine, you are able to communicate that information in an attractive way, 24/7. Using and sharing these business dashboards will promote a favourable data-driven culture within your organisation.
Become a data wizard in less than 1 hour!
SHARE YOUR KPIS WITH OUR HEROKU REPORTING
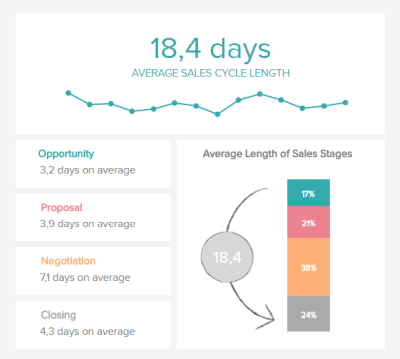
Once you have set up and tracked the Key Performance Indicators (KPIs) you need, you can compile and visualise them into a beautiful and interactive Heroku dashboard. You have the possibility to focus each and every of your dashboards on a specific theme – from app analytics to sales metrics, the choice is yours!
To push further, you can share your insights with anyone you want and with the degree of interactivity you want. You can access and provide access to colleagues anywhere at any time, and work conjointly on your reports with data that always stays up to date. To share your interactive reports and keep all your key players on the same page, it is as easy as sending a URL, and it is web-based too: no need for a local instance.
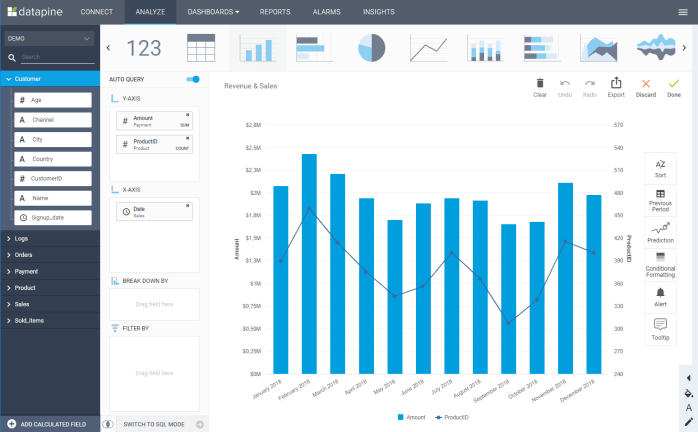
Get started with datapine’s Heroku analytics and fully enjoy our powerful and easy-to-use data analytics solution. Benefit from the compilation of all your sources in one centralised place and perform easily cross-database analyses, as we offer you native connectors to almost every data source. You can now do in a couple of clicks what used to be a difficult and time-consuming task of extracting and modelling data. You no longer need to rely on your IT department and wait for days or weeks before accessing outdated data, and answer critical business questions. At datapine, our goal is to give you the smoothest and fastest access to business intelligence: our intuitive drag & drop interface lets everyone, technical user or not, to deep dive into your Heroku analytics and reap actionable insights from it. If you are a more experienced user, however, you can benefit from our advanced SQL Query box and enter code manually, to perform the exact analysis you want to see. Likewise, we offer advanced chart options, that let you add secondary axis to your chart in a flash. Presenting two types of data on a single graph is the best way to display correlations that your audience will instantly grasp. Setting up our software only takes a couple of minutes, and will save you the hassle of synchronisation, as the data you are working with is always in real-time. Onboard our train and let yourself surprise by the easiness of data discovery!

Become a data wizard in less than 1 hour!