Analytics, BI Dashboards & Reports for SAP HANA
Explore, Visualise & Communicate SAP HANA Data With StyleTAKE ADVANTAGE OF OUR POWERFUL SAP HANA CONNECTOR
CONNECT YOUR SAP HANA WITH A FEW CLICKS
SAP HANA is an in-memory database platform, and can be deployed on-premise or on the cloud. Its main function is to store and retrieve data as requested by other software and it is best suited for performing advanced business analytics. The SAP HANA database is useful whenever you need to go deep and broad within data: running complex queries on enormous data sets of different types and from different sources. Our SAP HANA connector will let you use the full potential of that high-speed database, in combination with an easy yet powerful way to analyse your data and create stunning data visualisations. With datapine’s SAP HANA BI solution, turn your raw data into powerful insights that will bring value to your business strategy. In contrast to the complicated BI solutions SAP offers, you don’t need at any time database or technological knowledge to unlock the full potential of your company data. Forget about expensive SAP trainings and certifications and explore modern self-service analytics with datapine.
DYNAMIC & INTERACTIVE DASHBOARDING WITH OUR SAP HANA DASHBOARD BUILDER

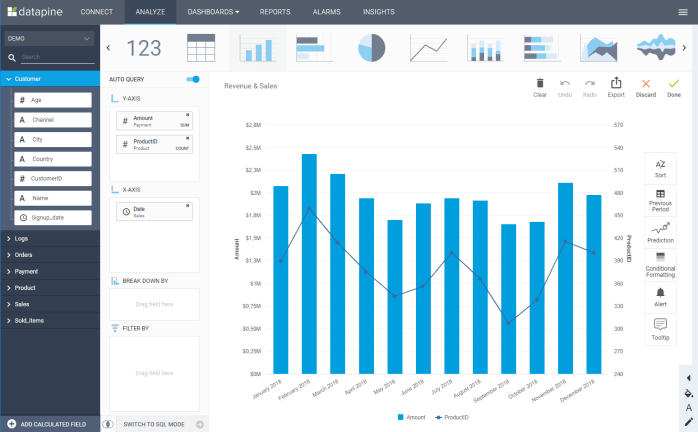
Let yourself conquer by the easy set up and use of datapine’s SAP HANA BI solution, and improve your data analysis with stunning data visualisations. Import all the data you need in one central place with a simple click, without any complicated and time-consuming preparation of coding or modelling beforehand. datapine’s SAP HANA Analytics empowers you and any member of your team to create meaningful graphs from the insights gleaned in your analyses – even without any specific database knowledge. You can connect directly to SAP HANA, and start digging in your data easily thanks to our user-friendly interface. Each interaction is automatically turned into a SQL Query – but if you are a more experienced user, you can directly enter code and perform the analysis you want to see. It is simple and designed to fit every need.
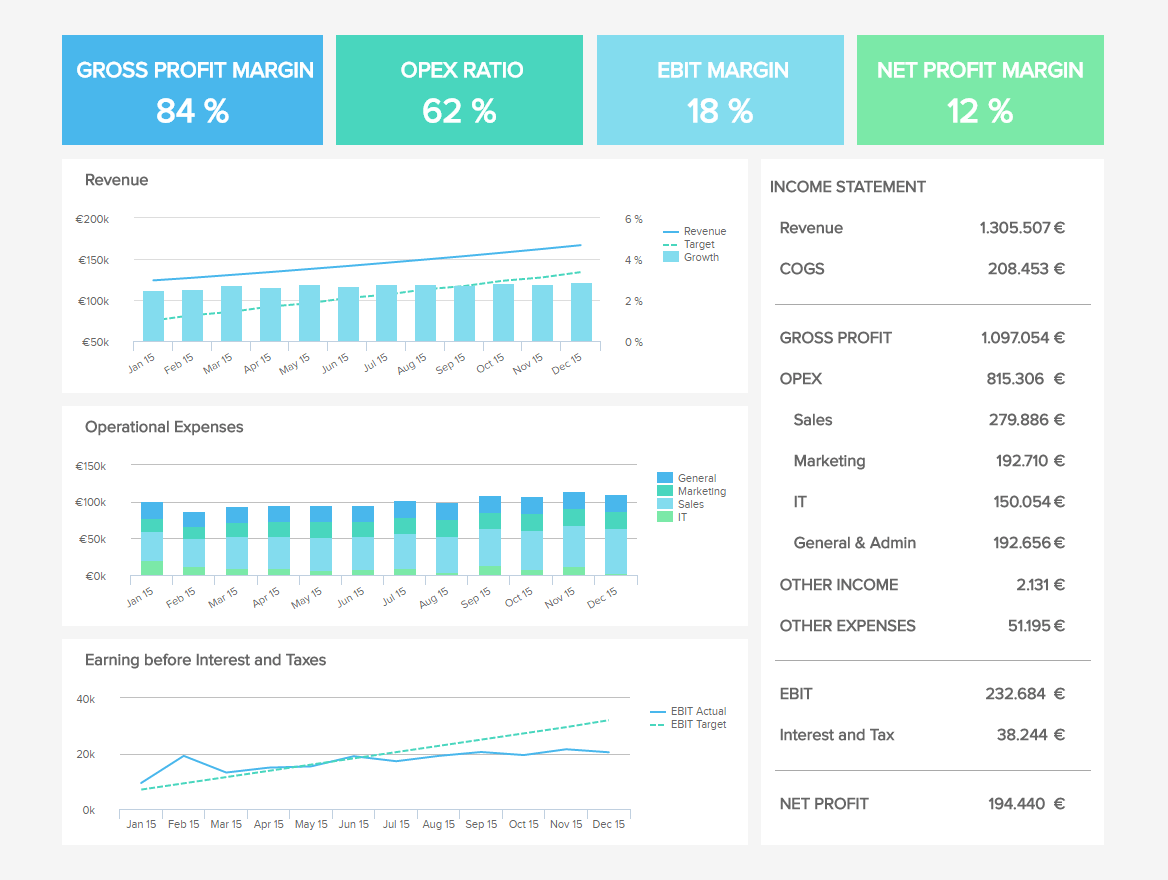
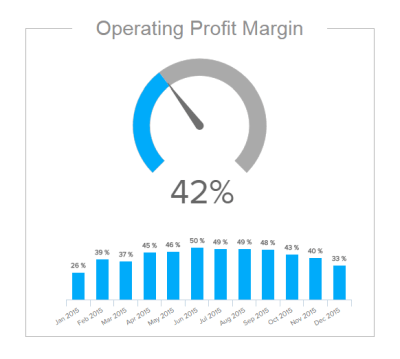
Bring the numbers to life thanks to the high level of data expressivity of our self-service BI software, and build compelling business dashboards to convey the information you want to tell. With datapine, you can experience the power of visual analytics like never before, and build professional dashboards thanks to a wealth of data visualisations. Choose among dozens of different charts, and add images, text boxes and frames to create the design that you like. Arrange and resize them easily at any moment, if new metrics have to be tracked and added to your SAP HANA BI dashboard. You can turn large data sets into valuable insights and support important operational processes, for a better informed, more efficient decision-making within the organisation.
Become a data wizard in less than 1 hour!
SHARE YOUR KPIS WITH OUR SAP HANA REPORTING
The possibility to access your information at any time and in any place is a must-have in our fast-paced, internet era. datapine’s scalable Software as a Service (SaaS) lets you connect from any internet-equipped device 24/7, wherever you happen to be on the planet. Report with confidence: the data you work with is always in real-time, so that you will never make poorly informed decisions based on outdated data.
Such flexibility is key to maintain your business analysis always up to date and anticipate any need that may arise. Track the Key Performance Indicators (KPIs) that matter with our easy-to-use SAP HANA Analytics, share them with the people you want securely, and let them interact with the data at their will for an enhanced analysis.
Get started with datapine’s SAP HANA analytics and fully enjoy our powerful and easy-to-use data analytics solution. Consolidate your data in one single point and benefit from our native connectors to almost every data sources. That way, you can perform advanced cross database queries with just a couple of clicks, without being an IT crack. We want to bring business intelligence to everyone, as easily as possible. This is why we empower you with an intuitive drag and drop interface, so as to enjoy the full potential of visual analytics without any SQL knowledge. Through stunning visuals, an improved sharing ability and real-time data, you benefit from the best in class business intelligence. With datapine, combine the flexibility of a SaaS to the efficiency of data visualisation: monitor the metrics that matter at any time, from anywhere, and bring them to life through compelling dashboards. Gone is the nightmare of synchronisation or reports-accumulation: you always work with information up to date and centralised in one place, that you can share at any moment with who you want and to the interactivity degree that you want. We offer a wealth of options to customise your dashboards to your company or client's colours, and add layers of interactivity – you can also benefit from advanced chart options.

Become a data wizard in less than 1 hour!