Analytics, BI Dashboards & Reports for Microsoft Azure
Explore, Visualise & Communicate Azure Data With StyleTAKE ADVANTAGE OF OUR POWERFUL MICROSOFT AZURE CONNECTOR
CONNECT YOUR AZURE DATA WITH A FEW CLICKS
SQL Azure is a cloud database service provided by Microsoft. It is, as the name states, based on an SQL server database technology and built on their Azure cloud computing platform. It enables organisations to store relational data in the cloud and quickly scale the size of their databases.
Connect within a few minutes your SQL Azure to datapine to enjoy the full potential of our advanced Azure BI solution. Alone or with other data source, start to perform your data analysis straight away and extract the insights that will make your business thrive.
DYNAMIC & INTERACTIVE DASHBOARDING WITH OUR AZURE DASHBOARD BUILDER

Work on your Azure analytics jointly with all your other data sources, as datapine enables you to easily and quickly perform mash-ups with data from any other sources. That way, you can find hidden connections between how your servers, or sensors, or any virtual machine, are performing. Crunch the massive data sets and the mountains of aggregated data to understand what’s behind them, and build a compelling Azure dashboard to display your findings in a graphical way, thanks to the wealth of data visualisations at your disposal. It is as easy as a drag and a drop with datapine – no advanced IT knowledge is required for you to read through your data and understand it.
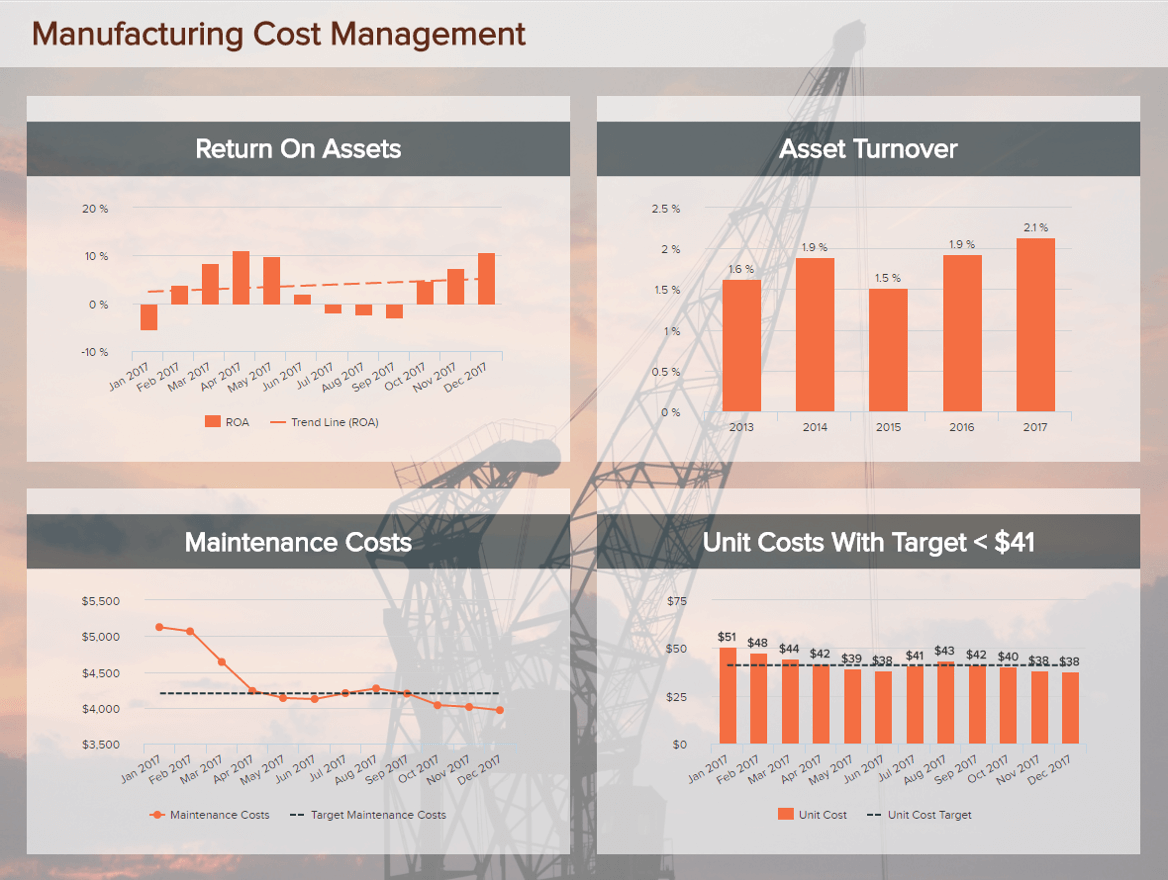
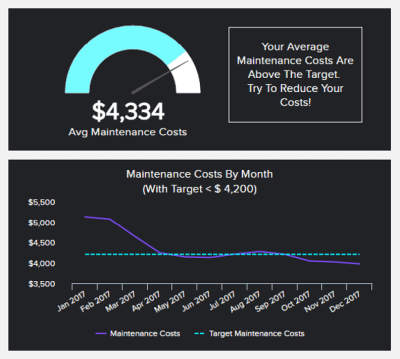
Build and customise your Azure dashboard with the many charts options available: line charts, area charts, gauge charts, spider’s web, and a dozen more. You can personalise the general look and feel to match it with your company or your client company’s colors, add text boxes, images, frames, etc. Share them the way you want, by setting up automatic email reports sent to the people of your choice, or by sharing a URL with the interactivity degree of your choice: drill-down, drill-through, filter, zoom-in, export, and many more to provide your colleagues and customer with the optimal level of control in their data exploration. Creating and sharing best in class dashboards is critical within an organisation, to quickly visualise the most essential information about current activities – this is why we at datapine want to make it as easy and fast as possible, with the convenience of cloud computing and the flexibility of SaaS.
Become a data wizard in less than 1 hour!
SHARE YOUR KPIS WITH OUR AZURE REPORTING
By connecting to our smart BI solution, you have access to your Azure analytics at any time and from anywhere, assured that the data you are working with is always up to date. With datapine’s user-friendly interface, anyone in your team can enjoy the power of analytics and interact with data to glean insights.
Do not keep the company data away from non-technical people and share your Azure dashboards with every member of your team so that they can work on it collaboratively. Then, you can easily share your reports with the people you want and with the interactivity degree that you want, with a simple click: be it an automated recurring report or a dynamic URL, the choice is yours.
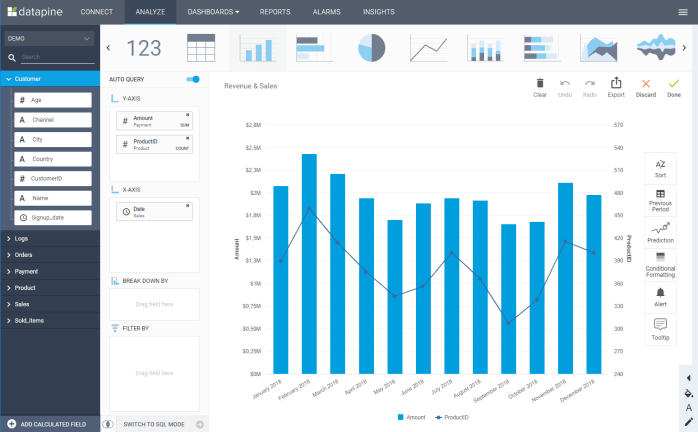
Get started with datapine and fully enjoy our powerful and easy-to-use Microsoft Azure BI solution. We aim at empowering anyone within a team to easily dig into data and extract insights, to share them later the best way possible: thanks to modern data visualisation. With our SQL Query builder, you are able to generate charts and graphs without writing a single line of SQL code. The intuitive drag & drop interface is here to smooth your analysis and through it, you can generate countless charts while your data is processed automatically in the background by our algorithm, that turns every interaction into a query. It just takes a couple of clicks for you to get in-depth data insights that will help you make better informed decisions and bring your business a step forward. If there are, however, some SQL wizards among you, you can enjoy our advanced SQL Query Box and manually enter code.
Our Azure BI solution was designed with the needs of business professionals in mind: thanks to the data consolidation in our single-point-of-truth, you are able to analyse large datasets and perform complex cross-database analysis to produce interactive dashboards. Onboard every one of your team by allowing your colleagues to work conjointly on the dashboards, access detailed information and monitor their performance through relevant KPIs. Report with confidence thanks to datapine’s automatic synchronisation that lets you work on real-time data. Give your business a boost thanks to an enhanced data-driven decision-making.

Become a data wizard in less than 1 hour!