Analytics, BI Dashboards & Reports for CSV Files
Explore, Visualise & Communicate CSV Data With StyleTAKE ADVANTAGE OF OUR EASY-TO-USE CSV FILES CONNECTOR
CONNECT YOUR CSV FILES WITH A FEW CLICKS
CSV is the name of a file format: it is a Comma Separated Value file that allows data to be saved in a table structure, and is used to store tabular data like spreadsheets or databases. They can be used in any spreadsheet program like Microsoft Excel, Open Office, Google Spreadsheets, etc. Import in datapine all your data stored in CSVs and other database servers or cloud sources, to analyse them conjointly. When connecting your CSVs to datapine you can choose between 2 options: uploading them manually from your computer or connecting your CSV via a link from your dropbox, box, Google Drive etc. This will be done in a couple of minutes and afterwards you can start to analyse CSV files right away. Move beyond boring tables in spreadsheets and visualise CSV files in a professional and collaborative environment.
BUILD DYNAMIC & INTERACTIVE DASHBOARDS BASED ON YOUR CSV FILES

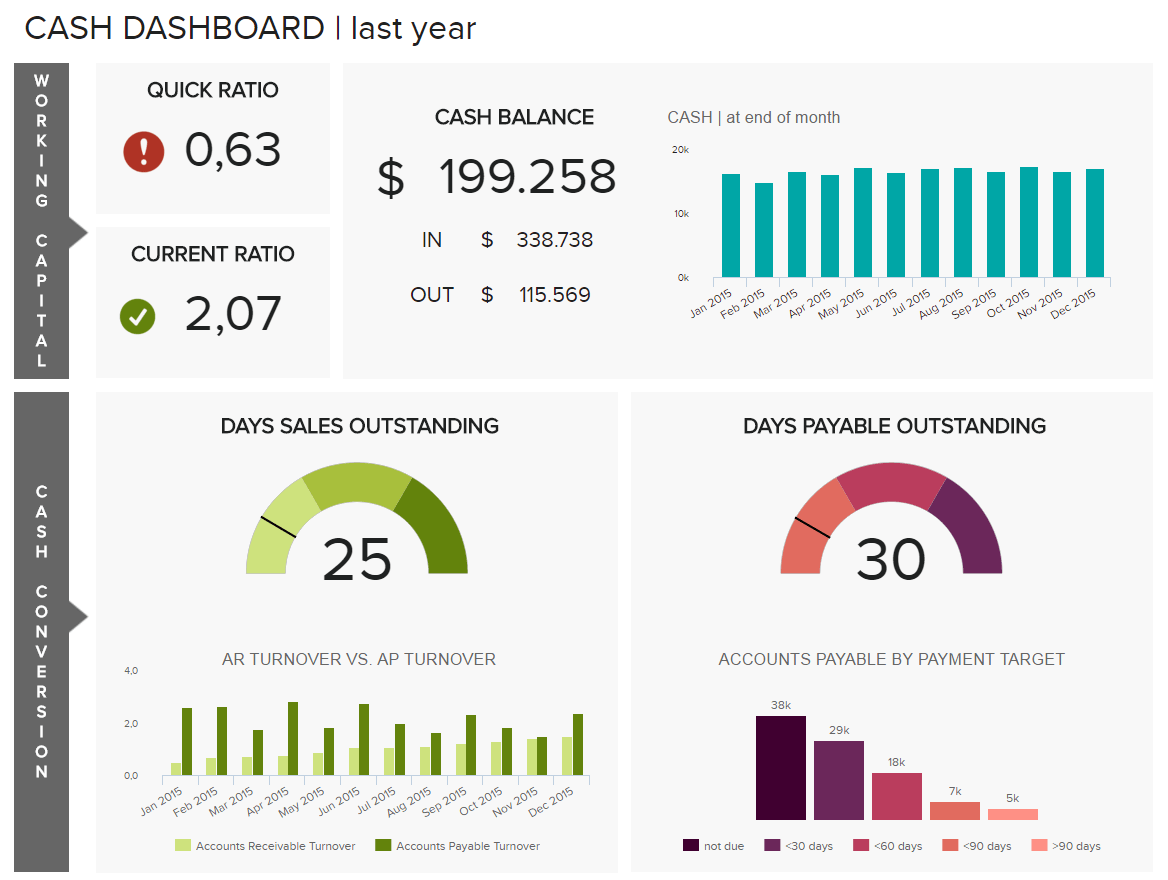
Beside your CSV files you can connect all common databases, web analytics, social media data as well as many CRM- or ERP-Systems to datapine. Benefit from datapine’s centralised data discovery environment and simplify complex, cross-databases data analyses by compiling all your sources there. Gone is the struggle of importing disparate data sources in Excel. Experience our visual and intuitive interface to perform advanced analyses, and take your BI strategy a step further by simplifying your work. It’s time to enjoy the use of professional dashboards to make better informed, data-driven decisions.
Become a data wizard in less than 1 hour!
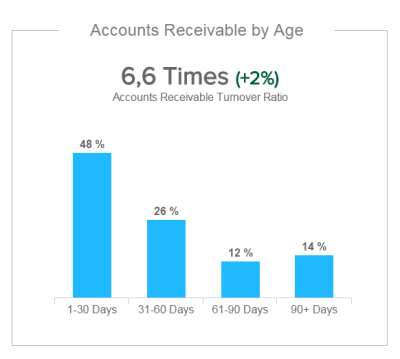
SSHARE YOUR KPIS WITH OUR CSV REPORTING
datapine provides you with fully a web-based, self-service analytics platform. You can access it at any time and from anywhere, with such an easy and flexible approach that you unburden your IT teams from a lot of data management and process.
Track you most important Key Performance Indicators (KPIs) with ease and choose from more than 15 stunning data visualisation types to always tell the best story with your data. Afterwards you can share your KPIs with automated E-Mail reports or share your KPI Dashboards via URL with selected receivers. Start now and visualise CSV files in a beautiful and effective way.
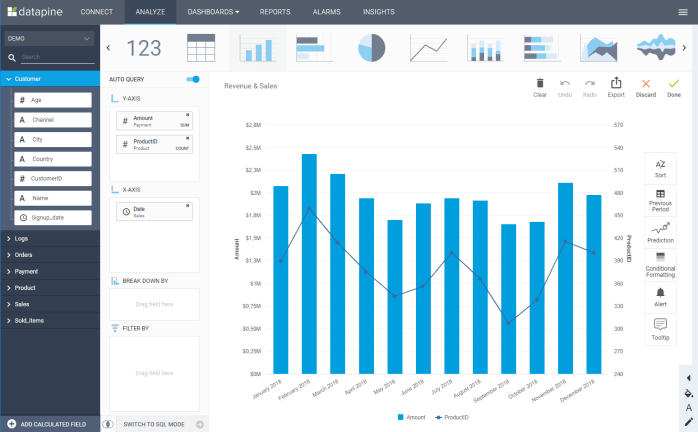
Get started with datapine’s advanced CSV analytics and fully enjoy our powerful and easy-to-use data analytics solution. Take advantage of advanced cross-database analysis, as we offer you native connectors to almost every data source. The intuitive drag & drop interface enables even non-technical user to dig into data and glean actionable insights from it. We make data discovery easy for everyone and enable you to be independent from your IT department to answer critical business questions. Setting up our software in a couple of clicks will gather all your data in one central place, and let you provide access to everyone who needs it, empowering each member of your team to work on analytics and visualise complex data.

Become a data wizard in less than 1 hour!