Analytics, BI Dashboards & Reports for Amazon Redshift
Explore, Visualise & Communicate Redshift Data With StyleTAKE ADVANTAGE OF OUR POWERFUL REDSHIFT CONNECTOR
CONNECT AMAZON REDSHIFT WITH A FEW CLICKS
Amazon Redshift is a data warehouse service hosting in the cloud, with datasets ranging from hundreds of gigabytes to a petabyte. They operate all the work of setting up, managing and scaling a data warehouse. If you own a database in the cloud, like with Redshift, it is a logical continuity to connect it to a business intelligence software to make sense of all your stored data.
Benefit from datapine’s easy-to-use Redshift connector and enjoy professional data analysis, smart dashboarding and reporting as well as real-time business insights at your fingertips.
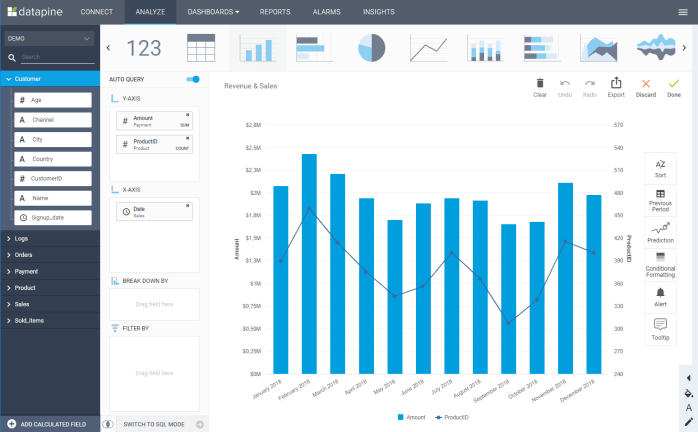
DYNAMIC & INTERACTIVE DASHBOARDING WITH OUR REDSHIFT DASHBOARD BUILDER


With our smart Redshift Analytics you may access your data from anywhere at any time, and join, query, and visualise your data to build compelling dashboards. With all your data centralised in one place, you have all the cards in hand to monitor the various aspects of your business and cross-analyse all your key metrics. The possibilities to drill-down, sort, pivot, filter or slice & dice let you explore your data to the point of interest: datapine’s interactive dashboards bring your Redshift reporting a step further. If you love working with data and want to dig a bit deeper, we got you covered: use our advanced SQL Query box and enter code manually to perform calculations, join data, or anything you want to see later in your data visualisation.
Grant everyone in your team to access these insights by sharing your dashboards and reports on-the-fly, and work collaboratively to produce enhanced data analysis with the contribution of all the minds inside or outside the office. We make it easy for you to work together and share your insights, with automated reports that can be sent as PDFs, PNGs or Excel files. If needed, you can also publish a link to your dashboard. Rest assured: all the information you will share will always be up-to-date, as our cloud-based solution works with real-time data. No need to manually update all your reports, it is automatically done by datapine. Take advantage of professional Redshift dashboards and reports with datapine!
Become a data wizard in less than 1 hour!
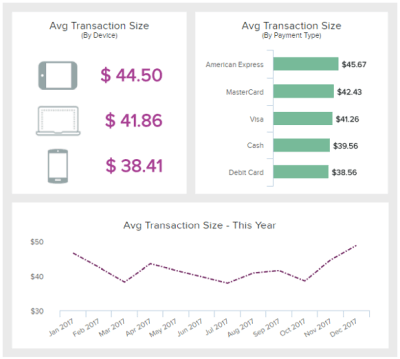
SHARE YOUR KPIS WITH OUR AMAZON REDSHIFT REPORTING
Our Redshift connector lets you process all your data stored in your Amazon’s Redshift databases, with the help of datapine’s powerful business analytics software. It is easy to set up, you can access our intuitive interface from any device and start building your data visualisations immediately. Combine the flexibility of a SaaS with the multifunctionality of an online data visualisation software, for an enhanced experience.
datapine brings your Redshift reporting a step further, since our data visualisation software enables you to create and customise beautiful charts that you can compile into stunning KPI dashboards. You will then be able to communicate your findings efficiently and make the right data-driven decisions that your business needs.
Get started with datapine’s Amazon Redshift Software and fully enjoy our powerful and easy-to-use Redshift Analytics solution. Take advantage of advanced cross database analysis, as we offer you native connectors to almost every data source. Our user-friendly drag & drop interface lets anyone, from the new intern to the experience data scientist, to dig into data and uncover actionable insights from it. We want to make data discovery a piece of cake for everyone, and empower small and mid-size businesses who do not have dedicated IT teams with the incredible potential of data analytics. We also want every business unit to be more independent and not rely solely on their tech department when they need reports and data to answer critical business questions. The need is here and now, so waiting for days or weeks for a data report does not make sense anymore in our fast-paced economy. Set up datapine in a couple of minutes and centralise all your information in one unique place, to work on it conjointly. Create and build compelling dashboard with our innovative Redshift analytics, that will help you visualise complex data to understand it better. Enjoy the many design options to personalise your dashboard to your taste, or to your brand’s look and feel, and create the best visual representations of your data. Then, easily customise your dashboards’ access for each user, with the level of interactivity that you want. It is as simple as that.

Become a data wizard in less than 1 hour!