
Client Dashboards & Reports How to take advantage of state-of-the-art client reporting
Professional Client Dashboards & Reports
Table of Content
1) What is a client report?
2) What is a client dashboard?
3) The importance of client dashboards & reports
4) Best practices for designing a client dashboard
5) Great client dashboard examples & templates
6) Essential features a client dashboard should have
If you’re an agency that deals with numerous clients or a company that relies on its resellers, you need to manage lots of data and information – all at once. You have the responsibility to handle resources, and budgets, and obtain the best possible results for your business to ensure profits and sustainable development. That said, introducing client dashboards and reports in your business operations could be the solution you were looking for.
In this article, we will explain what is a client report and a modern client management dashboard, provide reasons why they are important, and illustrate with examples that we will discuss later in the post. We will finish with factors and features to consider when creating such dashboards and reports for clients so you can have a comprehensive overview of everything that is related to this important topic. Let’s get started.
1) What Is A Client Report?
A client report is a tool used to send relevant up-to-date progress data to clients about their projects and strategies. They are often shared in the form of a dashboard, automated e-mail, shareable link, or embedded into the client’s system.
A proper client reporting process will be supported by a modern reporting software that reflects all the important information on a single screen, without the need to manually extract or analyze data, regardless of potential business scenario. To put its importance into perspective, we will now explain why they are so crucial for small businesses and large enterprises alike.
2) What Is A Client Dashboard?
A client dashboard is a modern management tool used by agencies, reseller and customers to visualize data in an interactive way and automate processes coming from various data sources in order to create dynamic reporting processes and increase productivity.
Each account you manage will require you to respect their brand guidelines and automate their data as much as possible, but at the same time, provide in-depth information about their business in a visual way, customized based on their specific parameters. You as a provider or agency need dashboard software that includes white label reports – that way, you can present your dashboard reports as your own, and no client will recognize that a third party is involved.
3) Why Are Professional Client Dashboards And Reports So Important In These Days?
If you are an agency, there is a big chance that you have struggled with endless client data management processes and informative presentations that could make or break your business. Each client is different, but they all have one thing in common: they require the most effective use of their time and resources. A well-maintained client reporting system would do the trick, but the importance lies within these additional points:
Enhance relationships: Getting all relevant performance data into one single location can significantly improve agency-client relationships. Even if you plan monthly progress meetings, a report enables you to talk with them regularly. This way, you can prevent minor issues from becoming big crises. You can also tell them that you are available for any questions, and keep them informed of any new developments. In the long run, this will also make the time for in-person meetings more efficient as your audience can bring questions based on what they have already seen in the report. This will not only improve your overall relationship but will provide added value to your service.
Dashboards keep each party accountable: Regular communication is essential in order to improve client relations and teamwork. By setting regular talks or reports about results or potential adjustments, clients will have a deeper understanding of the data at hand. When specific metrics are monitored, both parties will know what kind of goals should be achieved and how they will affect the business in the short or long-term. By communicating the right set of KPIs and ensuring that each stakeholder has a clear vision of what will be reported and when, accountability will set its course that will, ultimately, save precious time. And this is our next crucial point.
Real-time access and transparency: When it comes to dealing with customers’ data, transparency is key. Modern dashboards offer real-time updates so that all relevant users can be informed about the latest developments. Expanding on our last point about accountability, being able to see if anything is underperforming or overperforming will build a trusted relationship between the agency and its customers. With transparency at its core, this type of communication tool will also avoid any surprises at monthly progress meetings as well as build a team dynamic to solve any issues that might arise.
They will save numerous working hours and resources: If the communication process is fully automated, the time and resources can be easily saved and allocated to other important elements such as discussions and recommendations about the future. Turning to a client dashboard software for arranging all the business touchpoints under one roof is certainly a good strategy to save countless hours and manpower. We have already mentioned automation, but it deserves a separate point since it can provide a backbone to handle numerous accounts while letting the person that handles the data focus on what’s presented on a screen and eliminate unnecessary tasks.
They can be white-labeled and embedded: Agencies usually require a seamless solution to present their data to potential and regular customers. Regardless of the use case and requirements, the possibility of white-label and/or embedded software solutions seems like a smart move for companies looking to utilize the software as their own. But we will look at these options in more detail later in the article.
To not exclude the process for client dashboard design, we will present to you within the next part of the article some of the factors that companies should focus on while creating them.
4) How To Design A Client Dashboard? See Our Impactful Tips & Best Practices
The importance of creating a client reporting dashboard lies not just in general business advantages such as saving time, but knowing how to create one (or several) based on some important factors should also be emphasized. In order to create the best possible dashboard for your client and offer maximum value, here are the top best practices and tips you should follow:
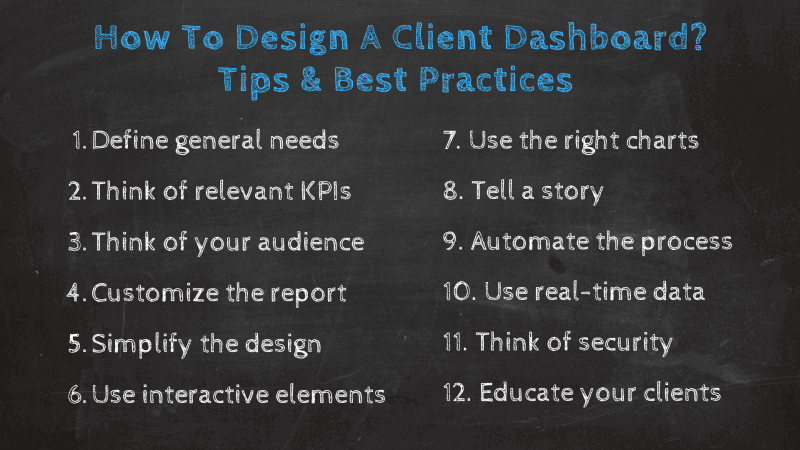
1. Define general needs
The first step when designing them is to take into consideration what your client’s needs are. This will define the direction you should take and what elements you should include to make the reporting process as efficient and targeted as possible. You can start by asking them a few relevant questions such as:
What are your goals for your brand?
What are the goals for this project?
Who is your target audience?
What are you expecting from us as an agency?
In addition to these valuable questions, you should also take a moment to understand how their businesses work, as well as what kind of relationship they want to have. Do they prefer to be fully involved in the analysis process or do they prefer only to receive monthly updates? Taking care of all these smaller details in advance will not only make the process more efficient on your end, but it will also show your customer that you value them on a personal level.
2. Think of relevant KPIs and benchmarks
After defining their needs, you also need to think about metrics and KPIs to help track specific goals. The performance indicators you choose should be directly related to the kind of project you are working on, be it SEO optimization, email marketing, social media, content creation, or any other. An important note here is to define your KPIs together with your clients; that way, you can make sure they are up to date with what is being measured.
On this note, it is also a relevant step to define performance targets. This can be based on past performance as well as competitors benchmarks. This way you will always have a number to compare your progress against. Make sure you keep your targets realistic. If you set up targets that are too high just to impress your customers, it can come back to bite you in the future.
3. Keep in mind your audience
While it’s essential to standardize the reporting process and the dashboard creation itself, each client is different, and they will require specific metrics and needs to be met. As an agency or company that deals with numerous business cases on a daily basis, and often in a fast-paced environment, keeping a clear picture of who your audience is and what you want to present with your data is crucial. Clients will only stay as long as you can provide clear value and their business grows. To ensure you stay on course, custom client dashboards need to have a clear focus on the audience and the message you’re trying to convey.
4. Customize the report
Now that you’ve defined your audience and their needs, you’ll get to the point where you need to start designing the report. An effective way to start on the right foot is to customize the look and feel of the report to meet your client’s branding, such as their logo, colors, font, and other things. This step will show professionalism on your part and make your audience way more engaged with your business. Plus, it will make the reporting friendlier and more interesting for them as they will see a familiar design. It Is important to note that not all reporting tools allow for advanced customization. Therefore, if you work with clients, we recommend making sure this option is available before investing in software. We will go into more detail about the specific customization feature you should look for later in the post.
5. Simplify the design and focus on the context
We often hear that less is more, and this is one of the factors that need special attention. Keeping a clean design that respects your clients’ branding requirements will make the dashboard easy to digest and information clear as it can be. By taking a focus on the most important metrics and keeping a straightforward design, you will achieve much more than implementing too many KPIs into a single dashboard. The design should definitely provide context and a comprehensive data story that answers important business questions.
6. Use interactive dashboard elements
In order to avoid overloading your dashboard with too many elements, it’s essential to use interactive elements such as drill-downs, click-to-filter, or time interval widgets, among others. This will ensure that it doesn’t have too many visualizations but delivers the option to explore the data in more detail. Interactivity and the possibility to utilize numerous filters play an important part in creating thorough client reports. With the help of online data visualization tools, you can put all the information into interactive charts, automate them and schedule their sharing with important stakeholders. This will prove to be an invaluable opportunity for any business.
7. Utilize the right chart type
Another crucial practice you should follow is to focus on the usage of the right chart type. There are numerous charts available, but each has the best scenario to use and it’s based on a simple premise, whether you want to show the relationship between the data, distribution, composition, or comparison. For example, a line chart is perfect for showing a comparison over a specific time period, but bubble charts can be an issue since they require too much mental effort from users. To make the most out of your efforts, take a moment and think about what your charts will represent and what you want to say with your visualizations.
8. Tell a story
The visual element is key when designing professional reports. Now, we already discussed the importance of using interactive data visualizations in our two previous points. Here we want to touch base on what you should do with those visualizations. Building an efficient narrative with the data will help your audience understand all the insights being presented there. Instead of just seeing a bunch of charts and numbers, your audience should be able to see the information as a story. This will make them feel more included in the process as well as avoid any misinterpretations. A few good practices when it comes to dashboard storytelling are to organize the information in a way that will tell a story, include texts to explain some of the metrics, and keep it simple. Don’t overdo it by including complicated metrics that are not providing any value.
9. Automate the process
Building reports is a tedious process for any type of organization. Especially for agencies that need to deal with different accounts simultaneously. For this reason, offloading the heavy work to automation is the best way to go. There are various online data analysis tools in the market that offer automated features. All you need to do is connect your data sources to the tool and your reports will be automatically generated within the desired timeframe. You can even preselect recipients and format in which you want the information to be sent to them. Like this, you can allocate your time and resources into building successful strategies instead.
10. Use real-time data
Another of the most important client reporting best practices is to include real-time insights. This ensures transparency about the progress of strategies as well as any relevant developments. It will also save time by avoiding several progress meetings. That said, it is important to let them know about short-term and long-term goals that they should expect beforehand. This way, you’ll avoid receiving anxious emails when they see the data is not showing positive numbers right away. Like other of the best practices and capabilities we mentioned on this list, real-time insights are not always a given in reporting tools. Traditional software such as Excel or PowerPoint only offers the possibility to generate static reports with historical data. Instead of relying on these tools, we suggest you look into more modern solutions such as datapine’s reporting tool.
11. Don’t neglect security
This is a best practice that applies to any data-related process but is especially important when talking about client reports. It would be catastrophic if your client’s sensitive data fell into the wrong hands because you didn’t handle security properly. Furthermore, an issue like this would not only harm your business’s reputation but can also have legal and financial repercussions that can significantly harm your business. Therefore, putting security as a top priority is of utmost importance. Some best practices when it comes to security include sharing your dashboards and reports via a password-protected URL or implementing user rights. User rights help define exactly which data a user can visualize in a dashboard and if they can manipulate or export that data. That way, you’ll make sure the information is only available to the right people. Other best practices that go more into the back-end logistics of your reporting process are to implement a data-usage policy across your organization, ensure you store the data in a secure location, implement strict access controls on devices, and use encryption, among other things.
12. Educate clients and be open to evolve
Last but not least, the last best practice is to educate your customers and be open to evolving in your work when needed. Take a moment to walk your customers through the reports and teach them how to interpret the results displayed there. This way, they will understand how your efforts reflect on the results and a collaborative conversation will take place. That said, once your client dashboard is up and running, your work is not done. A successful organization is bound to change, and your reporting should reflect those changes accordingly. Just like your audience will learn to interpret the data, you will learn from what they have to say about it and evolve into a more successful process.
These factors and benefits can be easily implemented in any use case, and if you want to take a closer look at the best practices, you can check out our article on the best dashboard design principles. Now we will focus on client dashboard examples and templates from various functions and industries you can use for your own dashboard processes.
5) Great Client Dashboard Examples & Templates
After expounding on the importance of building dashboards and reports to suit your clients, we will focus on seven client dashboard templates you can use in your own agency or organization. There are many potential areas of application for client analytics reporting. However, we will focus on a few hand-picked real-world examples to put their value into perspective. Let’s start with the marketing agency client dashboard.
1. Client marketing dashboard
As mentioned, agencies have a demanding working environment, often required to juggle between different campaigns, different accounts, and different advertising issues. With an astonishing 30% of total advertising revenue in the world, Google has proven to be one of the standard channels for promotional activities.
Google Ads are an important part of every marketing strategy a company performs. Often enough, Ads (formerly known as AdWords) is the go-to platform for marketers looking to obtain fast results in the SEA (search engine advertising) area and our digital marketing client dashboard example has considerable importance when dealing with ads campaigns:

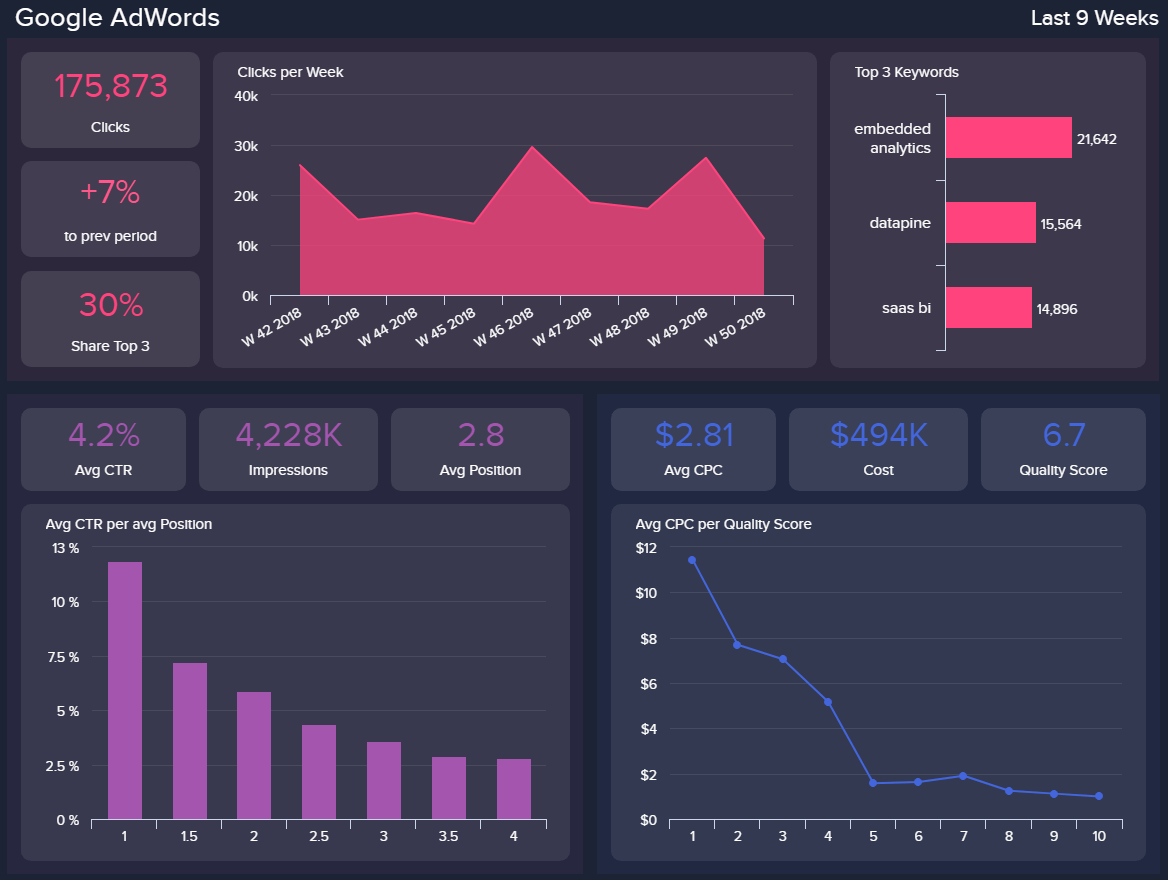
By taking a closer look at the data story we conveyed, this most insightful of client report examples is an ideal solution for agencies that manage Google Ads campaigns. The dashboard provides an instant overview of the most important metrics focusing on keyword performance. The upper part has 3 principal areas: general insights on clicks, the performance over a set period of weeks and the top 3 keywords. That way, you can immediately spot where your budget has been mostly spent. The lower part of the dashboard has its main focus on the average CTR and CPC but also delivers instant insights into the number of impressions, average position, cost, and quality score. When looking at these metrics holistically, every campaign manager can derive clear insights on his/her client’s account and recommend further steps for the next stages in Google advertising.
Campaign managers often manage multiple accounts, and with the possibility of creating a dashboard for digital agencies that will focus on each customer and provide real-time data while updates will be done automatically by the software will prove to be an invaluable tool for working in this competitive, yet rewarding, field.
2. Market research client report template
Market research agencies have the demanding task of managing and presenting large volumes of data to clients and various stakeholders. The plethora of information they have to deal with requires them to allocate most of their resources to compiling comprehensive presentations and results that will enable their audience to get a holistic overview of the market. Often enough, this task is tedious and complex, not to mention the processes that have happened before.
In many cases, market research companies use traditional means of reporting, such as spreadsheets and PowerPoint presentations, that can prolong not just the research process, but the presentation itself. Unfortunately, static data will not give agencies the opportunity to discuss the findings in more detail but only make them create another slide, another spreadsheet, or another lost meeting. Let’s take a look at how these processes can be simplified and upscaled within minutes.
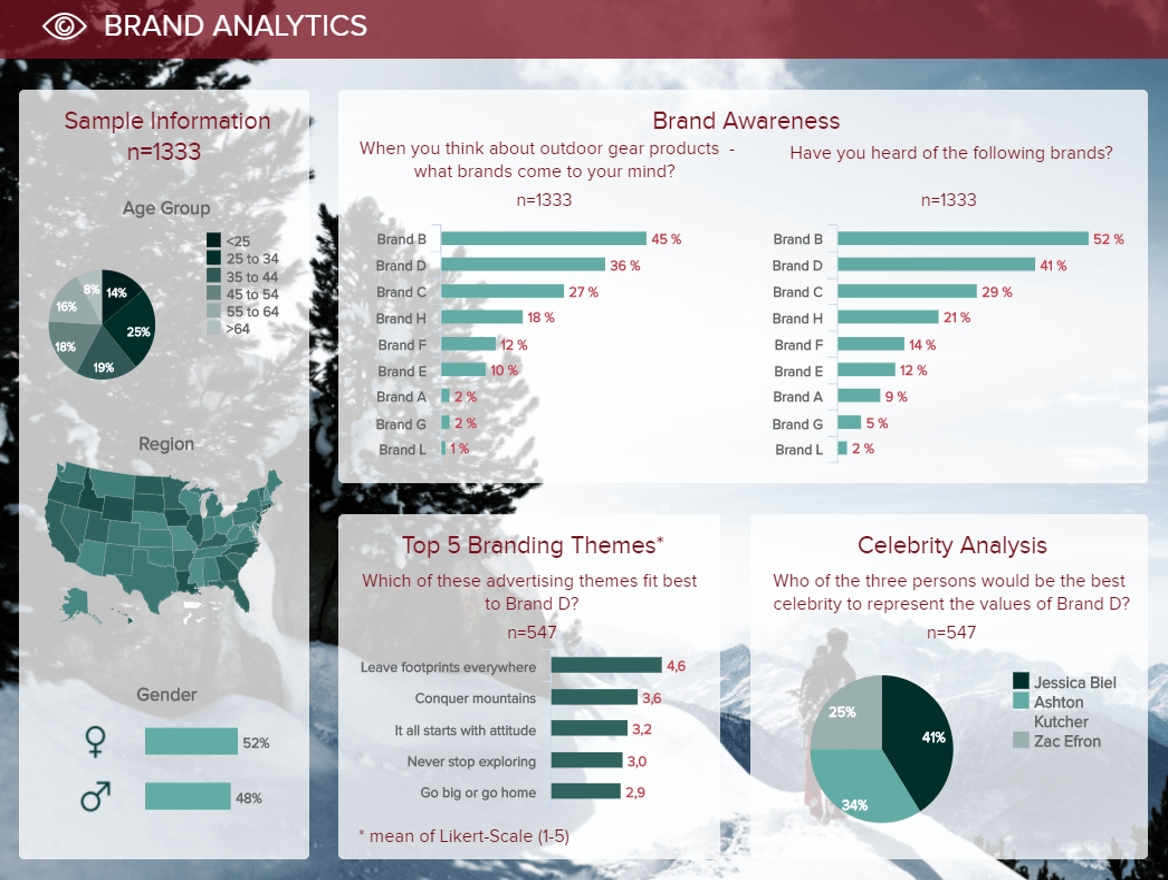
One of our best client dashboards is focused on a brand analysis study performed for a customer that requested to conduct a survey and present the results as clearly as possible. Numerous business questions were asked and PowerPoint would never be able to provide insights so quickly as this dashboard. The power lies within interactivity. Each metric can be filtered and drilled upon as much as needed, all while staying on a single screen and saving time on creating dozens of slides.
In this concrete case, 1 333 people were asked to answer specific questions about brands that provide insights to the client on how they perform in the public eye. People across the USA answered while the detailed demography can be clearly seen on the left side of the example. The right side delivers details about brand awareness through brand recall and recognition questions, while the bottom is focused on what kind of image the brand reflects and the impressions it leaves in public.
If the client has additional questions about the research, this template can always provide interactive features that will enable the agency to go through the presentation seamlessly and without numerous static slides.
3. Client project report
IT projects require steady control and a clear overview of all tasks that need to be done by a certain deadline. If deadlines aren’t being met, the team needs to know in advance to be able to adjust the scope and work strategies and avoid potential bottlenecks. Especially when working in an agency, clients want to know the status of their IT projects on a regular basis, and the project manager needs to deliver accurate and presentable data. By having a client report format such as the one below, every project can stay on track and critical issues can be identified on time.
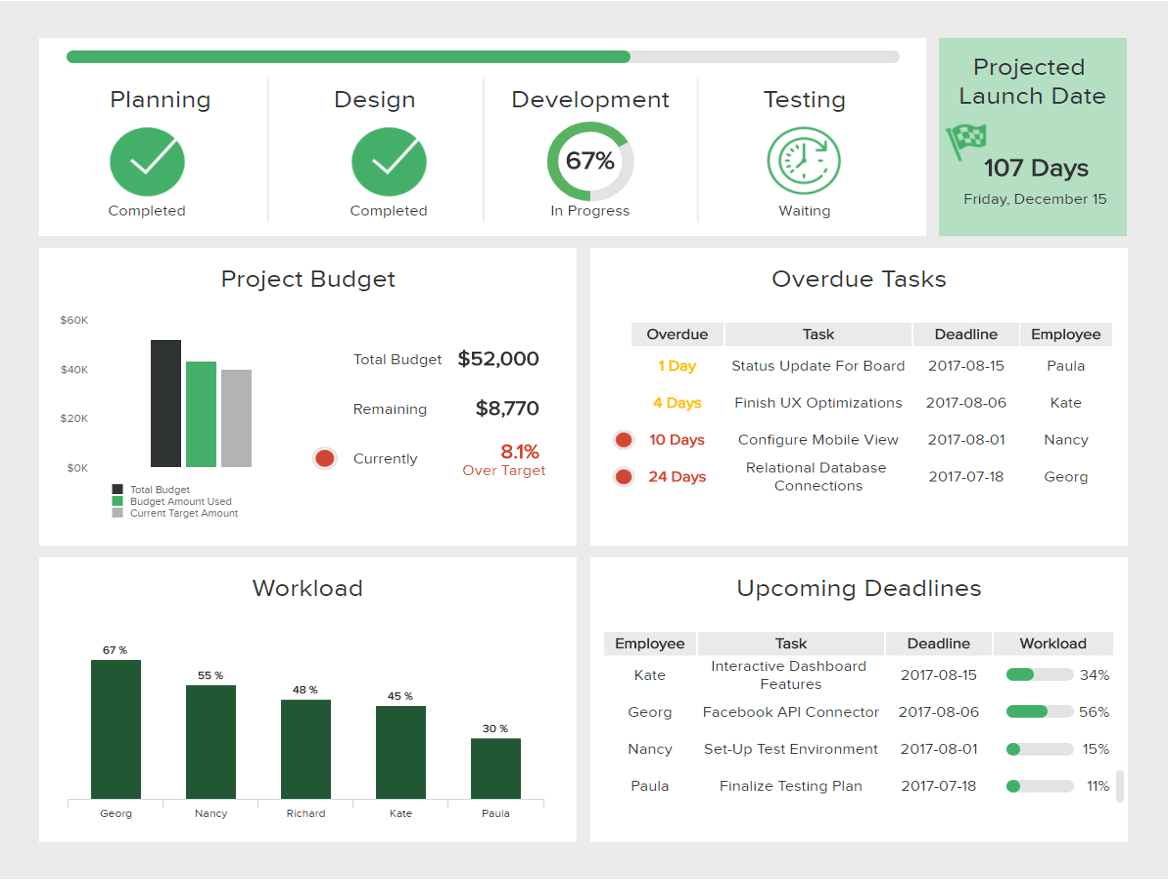
This dashboard can ease the agency’s efforts to present the status of the specific project effectively. At the very top, you can spot a quick overview of the stage the project is currently undergoing. The planning and design are finished while the development phase is currently at 67%. Next to it, the client can immediately see when the project is expected to launch. The central part answers crucial IT project questions about the budget and overdue tasks. The visual shows the distribution of the total budget, remaining, and over the target. In our example, you can see that the overrun extends more than 8%, which can be a topic for additional discussion to take a look at what caused this situation. On the right side, the overdue tasks will immediately tell you what is happening in your team and which tasks are not delivered. Maybe there is a connection between these overdue tasks and the increment of the budget? By talking to your team, you can see what kind of struggles they face and how you can help them.
The final part of this example will show the workload and upcoming deadlines. When you connect the dots, you can spot if some members of the team have too much workload on their hands and support them in finding a better solution for the project. Creating such a dashboard with the help of client reporting software will undeniably prove to be time-saving and efficient in terms of managing a project from start to finish.
4. Client dashboard template for sales & resellers
Suppose you’re a company that uses resellers for the distribution of its products. In that case, you might want to consider having all your data stored and managed from a single place and giving your resellers also access to their data. We illustrate this case with an example of a software company that uses resellers, but there are many other areas of applications. In essence, you can easily manage all your software resellers and they themselves can access the data no matter the location. This is a good example of white labeling the dashboard and distributing it throughout your operations. It can serve as a template that you can share with every single reseller where they can keep track of their performance. Let’s take a look at it by explaining some details.
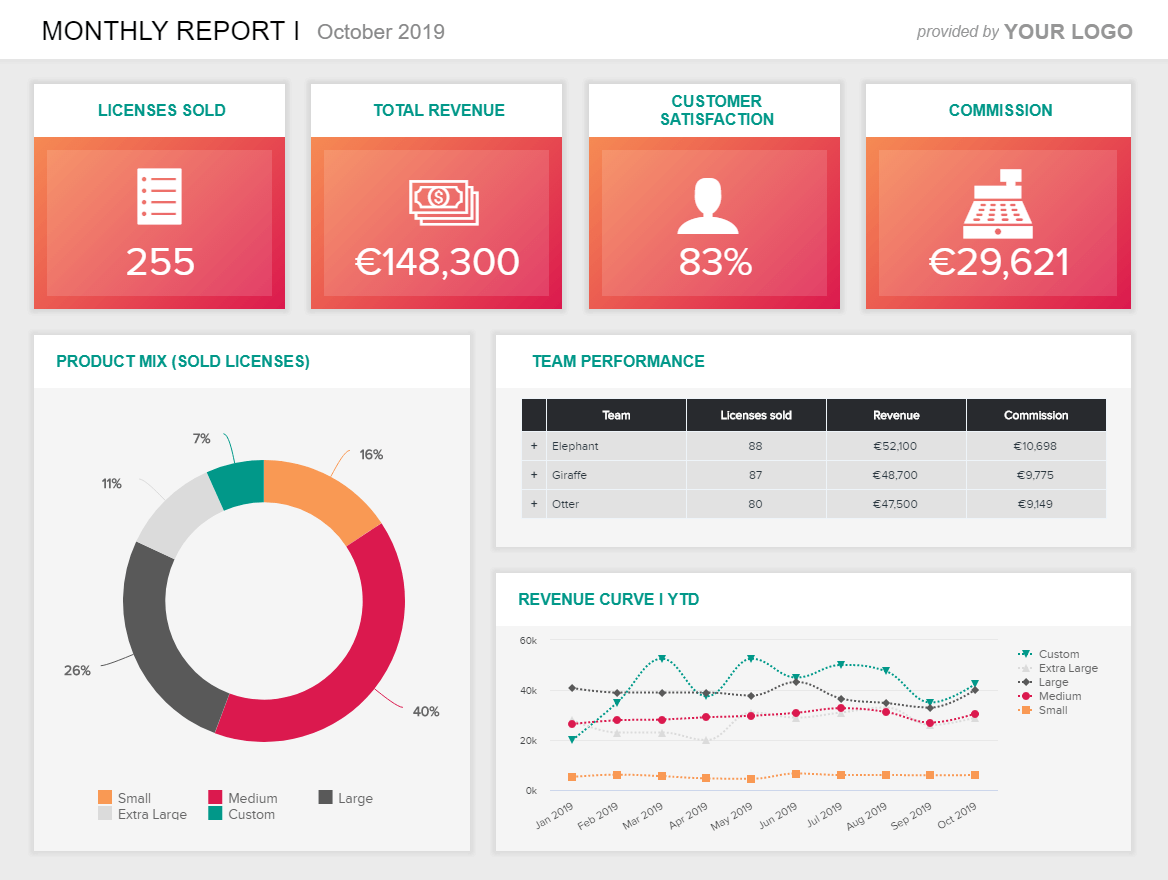
The upper part provides an at-a-glance overview of the total software licenses sold, the total revenue, customer satisfaction and commission earned. These metrics will reveal how successful your resellers have been and where do they need to allocate more resources. The goal is, of course, to have these numbers as high as possible so that the total earnings increase for both parties. The left part depicts the product mix of the sold licenses, whether the package is small, medium, large, extra-large or custom. In this case, we can see that 40% of the total packages sold are medium-sized. On the right side, the team performance can be viewed in more detail to see who has the best results and how they can help other team members to maximize the number of licenses sold, revenue, and commission. Last but not least, we get a visual of the revenue curve for each product sold expressed by YTD (year-to-date).
The point is that this client progress report can be viewed by the software company that has a number of resellers and needs a fast and reliable data management solution to improve each reseller’s performance and results.
5. Scorecard for social media performance
Our next example is a KPI scorecard that works perfectly for a marketing agency that needs to monitor the performance of various social media channels at a glance. By providing a summary of critical operational metrics in four main social channels, this scorecard can be the perfect tool to support discussions during meetings with clients as it tells relevant information about progress and achievements that can lead to further discussions. Let’s look into it in more detail.
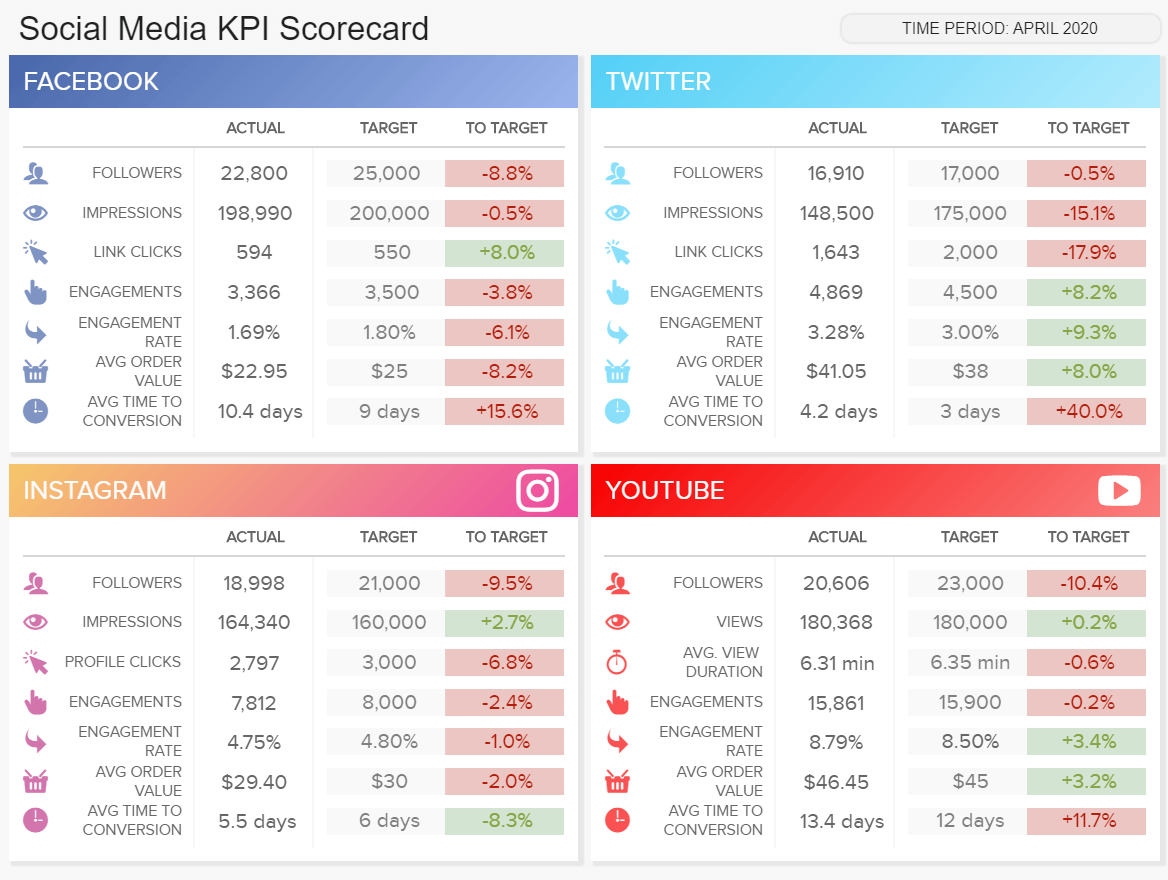
The scorecard provides useful performance information in critical metrics such as followers, impressions, engagement, clicks, views, among others. Each indicator is compared to a previous period as well as an expected target. If the metric is not reaching the expected target, it will be displayed in red (negative), and if it is reaching, or exceeding, the target it will be displayed in green (positive). This makes the data clearer and understandable at a glance and it can help the client and the agency find improvement opportunities and points of focus within seconds.
For instance, we can see that Facebook followers are 9% below the expected target which could tell us we are doing bad in this area. However, if we take a deeper look, we can see that, while it is 9% below target, it is also 2.3% higher than the previous period which means that progress is being made. This is a perfect example of how walking your clients through the process can make everything more understandable. Leaving them alone to interpret the results can lead to misunderstandings that can damage the relationship.
6. Marketing performance dashboard
We present another template that works perfectly for a marketing agency. Sometimes, clients need help understanding how their budget is spent in the marketing industry. That is because, unlike selling a product, the rewards for content, social media, or email campaigns are not as easily quantifiable. This template will help them understand exactly how their money is spent and materialize the results to gain a complete understanding of performance.
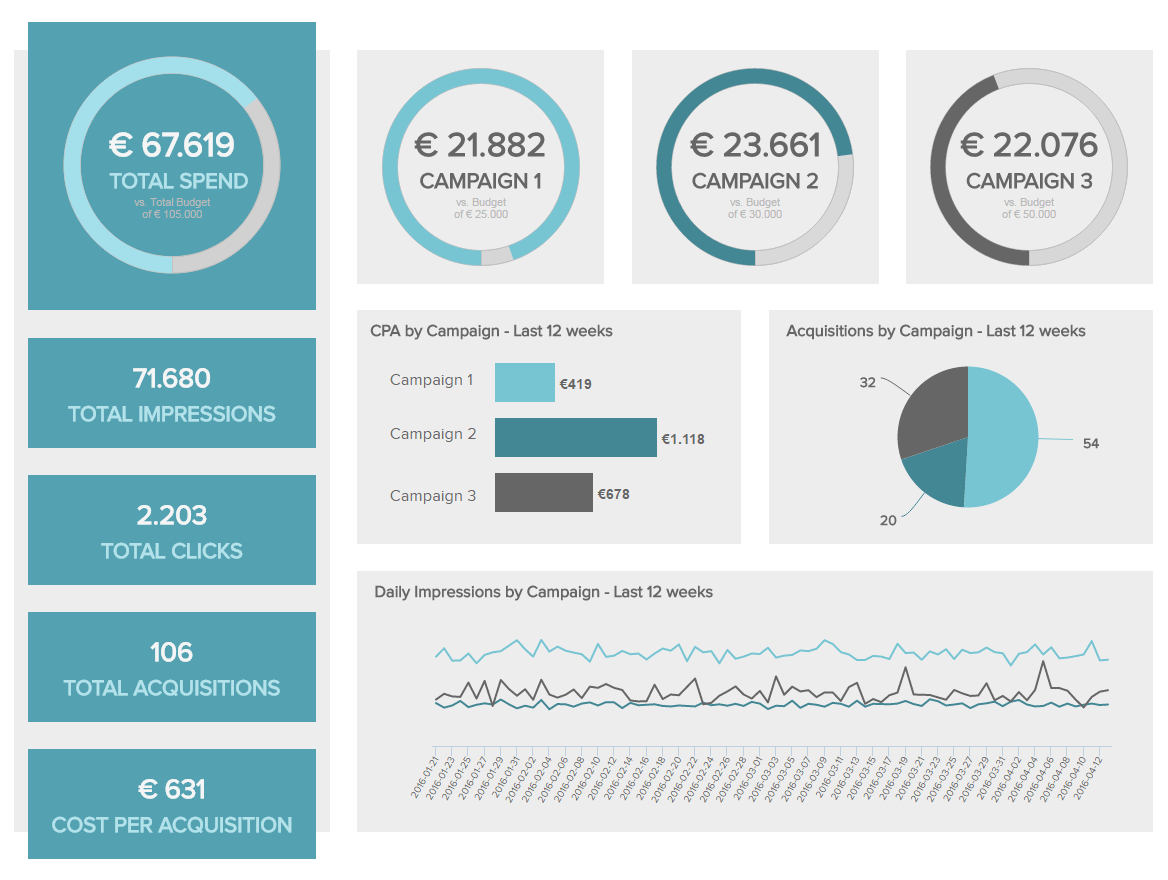
The template starts by providing a summary of key indicators that can let the audience understand progress in terms of total budget spend, impressions, clicks, total acquisitions, and the cost of those acquisitions. Each of these metrics is later broken down by campaigns to gain deeper insights into each performance. Finally, to help make the process more visually appealing, each campaign is differentiated with a color. That way, the user can easily identify each of them when analyzing the rest of the charts.
Going deeper into the actual numbers, we can observe that campaign one has almost reached its expected budget. Looking at the other charts, we see that this campaign has the highest number of impressions and acquisitions at the lowest cost. Therefore, we can conclude it was successful. Conversely, campaign two has the lowest number of impressions and acquisitions as the highest cost. That is something that needs to be looked at to make sure the budget is spent smartly.
7. Customer satisfaction dashboard
Last but not least, we have a client reporting template that relates to customer satisfaction. As you probably know, customers are the backbone of any business. After all, they are the ones purchasing your products, recommending you to friends, and engaging with your content. For that reason, keeping them engaged and happy should be a top priority.
Our last template can be a perfect market research agency tool. It displays the answers to a customer satisfaction survey with highly visual and interactive insights that can help the client understand the answers at a glance. For instance, the net promoter score and customer effort score are represented using a gauge chart with the colors red, yellow, and green for negative, medium, and positive answers, respectively. Since these colors are popularly linked to those characteristics, it is easy to understand their meaning with just a quick look. Plus, the direction of the thumb icons also helps.
The dashboard finalizes by showing an overview of satisfaction scores regarding quality, pricing, design, and service. Here we can observe some positive results in quality, pricing, and design, as well as some improvement opportunities in the service area, with only two stars in the “short wait” category. While there are four stars in “friendly” and “customized,” in the end, nobody wants to wait a long time for an issue to be solved. So, that is something to look into.
All these examples were created with datapine's dashboard maker suitable for agencies or companies no matter the size. Dashboards depicted here have all interactive features that enable users to dig deeper into the visualized data. We will now put our focus on the most prominent features you need to look for when creating such a dashboard.
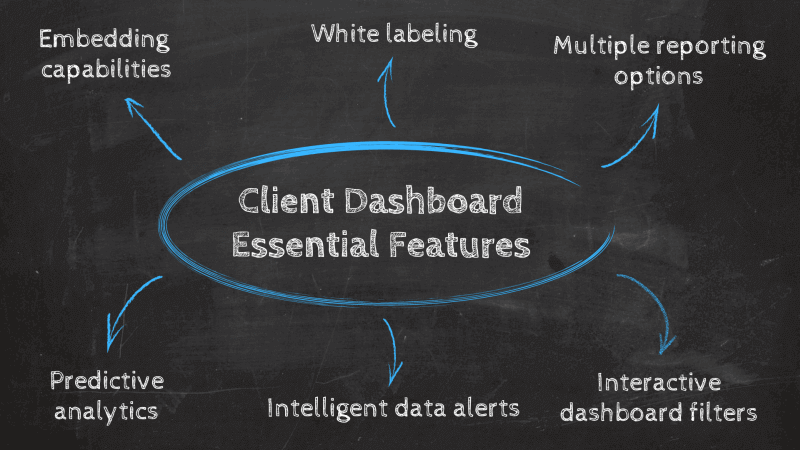
6) Essential Features Your Clients Dashboard Needs
Most companies will not find it useful to develop their own reporting solution but will consider using professional software that is already established on the market. Therefore, to ensure the most effective client dashboard reporting process, you need to look for fundamental features that these solutions must have on offer, and below we will discuss the most important ones.
1. Embedding capabilities
Embedding a software interface into your own application, intranet or solution where you can use dashboards and reports as your own has proven to be an invaluable resource for agencies and companies that need a dashboard tool for clients but don’t want to invest in developing their own software. This feature has numerous benefits since a company or agency has the full support of the software provider while using their existing business application. It can cut numerous costs related to creating traditional means of data management but also time to make effective business decisions. You can easily present dashboards as your own, and utilize all the features a software has on offer, without the need to invest in expensive IT developments and departments. Embedded BI tools offer seamless insights, real-time data, and a user-friendly interface that creates an effective analysis process throughout the company. If you need to present data to your client, embedding external software might make sense, especially if you manage multiple accounts and need a fast and reliable solution. Integrating such solutions into your own CRM, ERP, app or any other application you already use might prove to be the best possible investment for presenting data.
2. White labeling features
Closely connected to embedding, white labeling enables full branding capabilities such as implementing your own logo, color schemes, styling and complete customization that correlates with the demeanor of your brand. You will have complete control of the look and design of your dashboards and reports that you can easily distribute to multiple accounts. Your reporting across clients can become completely in tune with all your branding requirements, without the need for additional investments. Extending the analytics possibilities and dashboarding into a fully branded application will ensure your processes remain consistent and implemented uniformly into your existing workflow. That way, all your clients’ metrics can have your original visual stamp or even adjust the white labeling feature to each of them separately. This is ideal if you’re building a marketing client reporting dashboard and you need consistent visual representation, for example. Another case would be if you need to create a client progress report template such as the one we explained earlier, in our industry examples part of the article. White labeling is an option that will surely improve your client relations and bring positive results.
3. Multiple reporting options
Multiple clients require multiple reporting features, and you need to have options that will fulfill each potential request. That’s why having an online reporting tool that offers more than one reporting possibility is crucial to improve client relations and generating additional value. To put this into perspective, you can consider these options:
Standard reporting options: Through standard email reports you can easily send the snapshot of your dashboard to all designated recipients. By automating this report, you don’t need to create a completely new one each time you want to share new information.
Custom reports: Another option is to share a customizable report for each recipient. That might be useful if you’re dealing with multiple accounts and/or groups, and want to include different filters for each recipient.
Sharing live dashboards: A dashboard and all of its functionality’s can be shared through a public URL or secure viewer area where you enable rights for viewing only. That way, the recipient can’t edit the dashboard but has the possibility to use the filters you have assigned.
Embedding: As mentioned earlier, embedding will enable you to implement the dashboard into your own application, website or any other solution you might use and completely adjust to your existing workflow.
Quick printing: If a client requires, you can also print all of your dashboards and reports into a PDF or PNG format which can be a neat option for a personal meeting or a quick paper presentation.
4. Interactive dashboard features
Interactivity is an important part when generating a dashboard for client reporting processes. Metrics presented on the screen need to have the possibility to be explored additionally without remaining static at all times. That way, the client will have the opportunity to explore insights on their own and dig deep into the data as much as they need. Some of the interactive features include:
Drill-down: Drill-downs enable the user to view more detailed information about the visualized metric or element on the dashboard. By clicking on the KPI or any other variable, the dashboard will show a window that will take over the screen where you can see how the indicator unfolds with its details. This feature is useful since the dashboard will be manageable with only a few elements in the first place, but also enables the user to dig into the particularities of each element being presented.
Chart zoom: Drilling into the smallest units of time by using a time field is what chart zoom is all about. Multiple layers of knowledge and data are presented on a dashboard, and chart zoom can expand this knowledge into each bit and piece. By selecting the specific time area, you can explore your metric more granularly and narrowly, whether on an hourly basis, daily, weekly, monthly or yearly. This feature has proven useful when you want to take a closer look at what happened at a particular moment in time, without manually searching for information through another overcrowded spreadsheet.
Widget linking: If you are managing multiple client business cases, then widget linking will save you numerous hours. For example, if you want your marketing client reporting dashboard to contain specific data about each promotional activity, whether social, organic or paid. The widget linking option will enable you to move from a specific marketing overview chart to a related dashboard tab that obtains more details about the specific promotional channel. You can also link to an external resource or website; the choice is yours. These redirecting options will prove to be significant when you need to layer your data with numerous snapshots of your client’s business performance.
5. Intelligent data alerts
Intelligent data alerts are another feature that can prove valuable for your client reporting efforts. Essentially, these alerts, which are powered by artificial intelligence, will notify you (or your clients) about any relevant developments or unexpected events in the reports. You just need to select the KPI you want to monitor, and the software will notify you via email or directly on your mobile dashboard if anything needs your attention.
These alerts prove extremely valuable as they eliminate the need to constantly check the reports and allow you to promptly spot and tackle any issues and uncover valuable trends and patterns. From a client perspective, they also serve as great engagement tools. You can set an threshold alert to notify them about a positive goal being achieved and show how your strategies are being successful.
6. Predictive analytics
Last but not least, predictive analytics capabilities can take your reporting efforts to the next level. A predictive analytics algorithm analyzes your historical and current data and generates accurate forecasts about what will happen in the future. This unique capability provides added value to your clients as you can help them develop informed strategies and ensure resources are allocated smartly. For example, if you are a marketing agency, you can identify periods in which sales are likely to go up based on historical trends and define promotional strategies to ensure the sales potential is reached. Going a step further, you can also use predictive analytics models to identify prospects similar to your client’s current customer base and boost their acquisition rates.
You can give many use cases to predictive analytics in a dashboarding and analytical context. Tools such as datapine provide predictive capabilities in a user-friendly interface without prior technical knowledge. That way, all employees across your organization can integrate predictions into their dashboards and provide clients with added value.
These features are a great start to create your dashboards, no matter if you need a detailed client ROI report for agencies or a comprehensive project management interactive overview. To gain a detailed overview of additional dynamic features, check out our article on interactive dashboards where you can find a comprehensive list of the most valuable features you should look for.
6) CONCLUSION & NEXT STEPS YOU SHOULD TAKE
We have explained how to write a client report by utilizing modern software, took a detailed look into its importance, and provided examples from industries and functions where they can be extremely beneficial. datapine has proven to adjust to the particular needs of each agency or company that needs to manage numerous clients and accounts simultaneously. We have saved countless hours and increased productivity for numerous workflows across industries and functions. If you want to test our product and see how much value we can bring, we invite you to try our solution for a 14-day trial – completely free of charge.
Start your free trial and take advantage of modern client dashboard software today!