
Business Intelligence Solutions How to benefit from the best BI solutions on the market
MODERN BI SOLUTIONS FOR EVERY INDUSTRY AND FUNCTION
Table of Content
1) What are BI solutions?
2) What are the benefits of modern BI solutions?
3) BI solution examples by business function
4) Examples for industry BI solutions
5) Implementation Best Practices
6) Conclusion & Guidance
Helping companies of all sizes to turn data into insights is the ultimate goal of business intelligence and modern data analyst tools that, in recent years, have become a critical necessity and completely eliminated guesswork. Achieving the full potential that databases have on offer, increasing performance and improving business processes through effective BI solutions is not only done by large enterprises, but mid-size and small businesses alike. Each professional in our cutthroat digital age has the responsibility to perform the best possible data management for his/her area, and by taking advantage of modern business intelligence solutions organisations will not only have a complete overview of their data but have easy access to various touchpoints needed for successful operational and strategic activities.
We will start this article by explaining what are BI solutions, continue with the most prominent benefits that enable businesses to solve their problems, describe and present business intelligence solutions examples by industry and business function (departments) that you can apply in your own organisation, no matter if it’s retail, healthcare, IT, sales, marketing, logistics, etc. Finally, we will conclude and round up our findings to enable you to build your own solution and upscale your business.
1) What Are BI Solutions?
Business intelligence (BI) solutions are designed to help executives, data analysts, team leaders, managers and professionals to collect, analyse, visualise and report on various functions within a company and apply those findings to their respective industries.
These tools enable users to perform self-service analysis without the need for profound technical knowledge. Besides an intuitive drag and drop interface, many tools have advanced features and analysis options such as a SQL mode or calculated fields to fulfil the needs of more advanced users. Industry, function or platform aside, business intelligence technology solutions save numerous hours of work, and relieve leaders and professionals from the tedious and repetitive tasks of exporting numerous spreadsheets that have the data locked in history. But let’s see these benefits in more detail.
2) Benefits Of BI – What Problems Can Business Intelligence Solutions Solve?
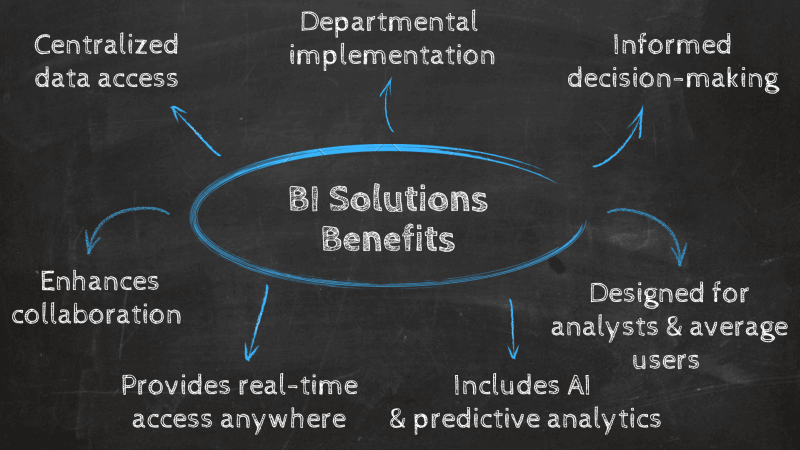
Every business has the same goal: turn data into actionable insights and outperform established metrics. By doing so, every organisation has a solid foundation to ensure sustainable development and generate more revenue while saving precious time. Here are the most prominent benefits that will help you solve any business question you might have:
a) Centralised access to all your data
It is no secret that the amount of data businesses generate is growing at an increasing pace. This data is collected from internal sources such as operations, employees, and finances, and external ones such as customers, market trends, and competitors.
Managing all that information presents a huge challenge for organisations. The incorrect use of data can significantly harm the decision-making process and delay or even cancel all growth efforts. This is especially important considering that half of the fresh data organisations collect has at least one critical error. Making caring for all aspects related to efficient data management fundamental.
Some aspects include security, quality, and accessibility, which means providing the correct environment for all relevant users (employees, managers, and others) to access, manipulate, and analyse the information and use it to inform their daily work. Enterprise BI solutions and services assist with the process by providing centralised access to all relevant data sources in a user-friendly environment. That way, all users can access quality insights in real-time, regardless of their technical knowledge. All they need to do is connect their most important sources using professional data connectors, and the tool will prepare and update the data so it is always ready for analysis. In time, this will not only boost accessibility and efficiency but will also allow for a collaborative environment between departments. More on this in the next point.
b) Implementation in any department or industry
A business executive or manager might need access to data across the company, including marketing and sales to help him/her to make a better, more informed decision. The possibility that a business intelligence solution has on offer focuses on implementation in any industry, any function, and any data source your company might have or need. That means that a comprehensive overview can be obtained by simply implementing one of the best BI tools for your concrete business case.
It’s essential to mention that nowadays, there are top BI solutions on the market that every department can benefit from, whether you are part of marketing, sales, market research, customer support, etc. In the process of finding the right BI software, the requirements of all departments should be checked to make sure that, in the end, all different departmental needs are met and that your company doesn’t need additional BI and/or analytics services. That way, you can save additional costs and comfortably choose a business intelligence solutions provider to satisfy all your business’s requirements.
For example, it is often the case that departments work separately and have no touchpoints with each other nor properly developed communication systems that will enable them to comprehend a business story in more detail. The IT department might not know what happens in marketing, and business managers might need to request numerous reports from various stakeholders to be able to develop their own views and recommendations. The financial department needs a birds-eye view of every cost a company has, but looking for the right information at the right time or constantly double-checking the costs and relevant metrics, updating data, and sending thorough reports might seem like a business nightmare. Often enough, these situations can cause a slowdown in business processes and a company can suffer immensely. That’s why checking and choosing the best possible solution should be high on your list to avoid future cost increments or potential bottlenecks. Later in the article, we will illustrate real-world examples for different industries and functions so you can get an idea of what kind of result you can obtain with modern and professional BI software.
c) Allows for informed decision-making
Before data and analytics, decision-makers generated strategies based purely on experience or intuition. While this technique might have worked in the past, it didn’t take long before some of the most innovative organisations started to turn to their historical data and generate reports to use against their competitors. A few decades from that time, data and reporting have become less of a competitive advantage and more of a fundamental requirement for efficient decision-making.
The level of knowledge provided by professional BI services and their related processes gives businesses a 360-view of every relevant aspect regarding their performance. Through this, they can make informed decisions based on their most critical current and historical data as well as identify trends, patterns, and improvement opportunities to ensure every drop of knowledge is put to good use. In time, this will not only boost organisational growth but will also ensure resources are spent smartly.
d) Designed for both data analysts and average business users
Modern self-service BI tools provide options tailored for average business users, data analysts, or advanced data scientists. They need to capture different business modes that will enable each employee, no matter the background, to be able to fully comprehend and create a data story, oftentimes visualised in a striking online dashboard. Understanding what a data scientist does or connecting an analyst with a business manager can only bring positive results because each employee can consolidate their data into one point through software and access any information they might need to be able to perform their tasks more effectively.
That said, business intelligence brings smart and innovative answers to various teams, increasing the cross-functionality of data and enabling a smooth user experience for the best data management processes and business results. By simply connecting the data source you need, you can easily analyse your information with the help of a seamless user interface or switch to advanced SQL mode. As mentioned, by simply using a smooth drag-and-drop UI, every average user can perform deep analysis and share their findings with relevant colleagues or stakeholders. That way, access to data is possible for everyone, keeping the final result in the form of a dashboard and/or report – simple, yet effective.
e) Includes artificial intelligence and predictive analytics
As we all know it, managing large volumes of data on a daily basis has become a big challenge. A smart BI solution aims to automate and quickly perform analysis of enormous datasets that will empower users to focus on what truly matters: actionable insights. That means that traditional means of collecting and analysing data, such as spreadsheets, no longer bring added value, but challenge organisations in their time management and cost allocation, often much higher than planned. There is simply too much complex data to analyse and, consequently, companies must turn to modern business intelligence system solutions that have AI and predictive analytics on offer.
Artificial Intelligence (AI): Modern software backed up with artificial intelligence, such as intelligent alarms, uses neural networks and historical data to ensure users receive a notification each time a business anomaly occurs. This way, they can control everything that happens with their data without the need for manual calculations.
Predictive Analytics: To save even more time, such tools have implemented predictive analytics, a highly sophisticated element for predicting the future of a company and providing a roadmap to where the data will be and how it will behave. The opportunity to know the future and prepare for it should be one of the key elements in the decision-making process.
f) Provides real-time monitoring and access to data, anywhere, anytime
Turning to BI involves many standard, tedious processes such as exporting numerous spreadsheets that can be automated by creating powerful dashboards accompanied by a number of interactive charts that you can adjust and incorporate with just a few clicks. These dashboards provide access to real-time data, refresh automatically, and have interactivity in nature to enable users to simply click on a part of the dashboard, and explore the data further.
This is possible thanks to numerous features that enable real-time monitoring and evaluation such as drill downs, chart filters, time intervals, tooltips, etc. The time to wait for a report from the IT department is cut down into a few clicks within the software interface. No one needs to wait to see the performance of their company or department anymore and no one needs to perform analysis with historical data only. This benefit seamlessly decreases the time companies spend on creating and generating reports but, most importantly, enables access to information whenever it’s needed. As a result, no matter if you’re sitting in a meeting, traveling, or just checking your mobile – the data will be there, instantly.
g) Enhances collaboration across departments
As we already mentioned, BI can be implemented across all departments and areas of a business. This not only helps in meeting all the analytical requirements of each team but also keeps everyone connected and working towards the same business goals. Still, many organisations fail to realise the value of an efficiently connected workforce.
Even with online work becoming a new normal after the pandemic, there are still many companies and teams that communicate through endless email chains or long, unnecessary meetings.
With professional BI software, employees and teams are fully connected through the use of professional dashboards. These dashboards can be accessed online from any device with an internet connection, allowing teams to be informed about strategies and any relevant developments. Plus, dashboards can be used during meetings to support discussions. Boosting productivity and optimising employee’s time in the process.
Finally, these benefits are a solid foundation for you to understand what are business intelligence solutions bringing to the table and how companies can profit from investing in software to take care of large volumes of manual tasks that slow down any operation, no matter the industry or department. In the next part of the article, we will focus on business intelligence by industry and functions and take a detailed look into examples of each.
3) BI Solutions By Function – Maximising The Departmental Performance
The best part of business intelligence is the possibility to apply them in any industry or business function. Whether you are part of sales, marketing, procurement or human resources, each department must perform well to generate business value in the long run. To inspire you in the process of looking for the perfect solution, we have gathered some of the most prominent functions a company employs and will present you real world BI dashboard examples.
1. Human resources (HR)
Today, human resources are one of the principal functions of an organisation. The number of applications, workforce management, recruitment processes, and the analysis of staff has risen to the point where manual screening and optimising processes is no longer possible. Keeping a company’s human aspect healthy and productive while welcoming the best candidates for the advertised position are crucial elements of success. Business intelligence can upscale all of these processes with advanced analytics and visualisations that will enable each member of the team to see a clear overview of the state of human resources. That’s why an HR dashboard is usually a good solution to all the business requirements related to human resources:

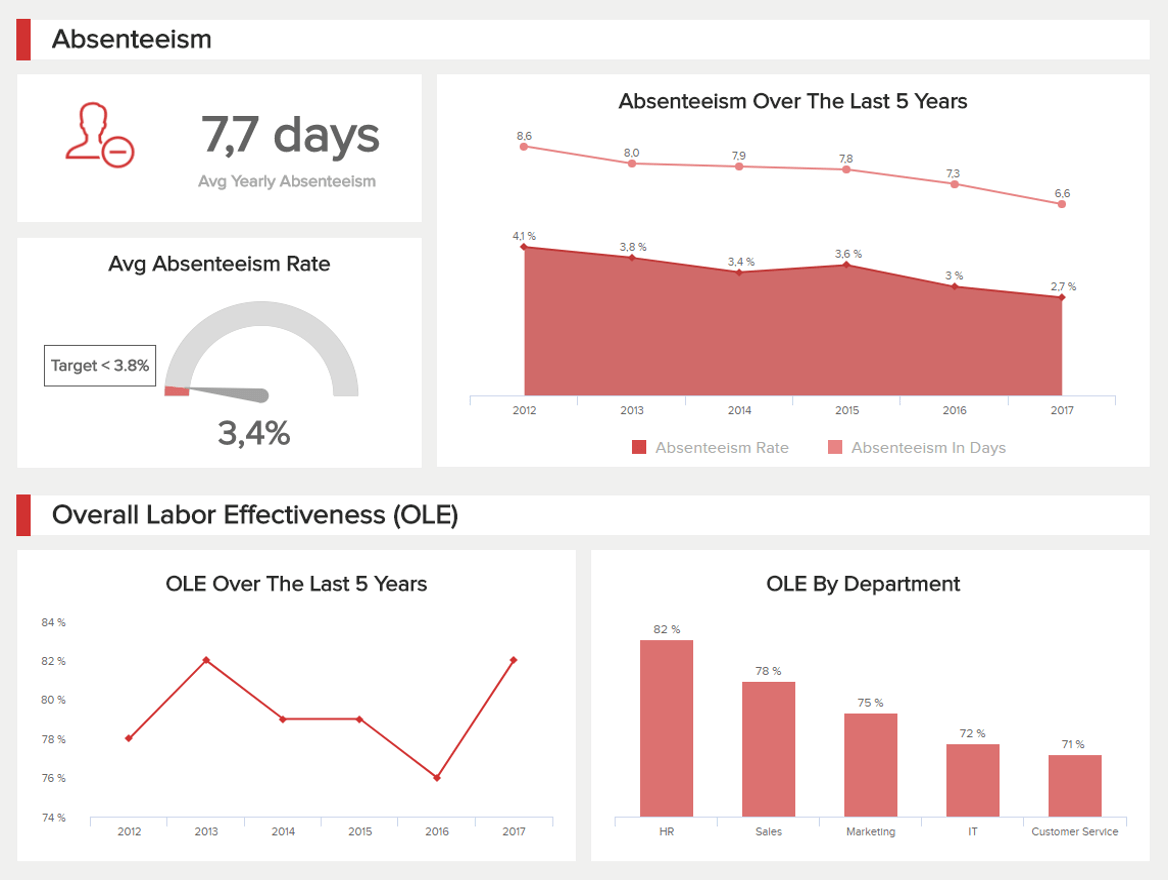
Our dashboard above is focused on employee performance over a set period of time. As we all know it, employees are the beating heart of any business and if they don’t function properly, there is something deeply wrong on a management level. Metrics such as absenteeism, and overall labour effectiveness categorised additionally by the department, and structured in a time frame of 5 years can clearly tell you how your employees are performing and if they’re satisfied at their workplace. If any of the metrics raises concerns, it is time to focus on people management and schedule some meetings.
2. Procurement
A department found in most companies, procurement has a specific set of best practices to follow in order to become and stay successful. Management of suppliers and the whole procurement cycle can easily be automated, predicted and monitored with the help of a modern procurement dashboard empowered with intelligent features that every procurement department needs:

To be able to play in our competitive business environment, companies must deliver the best possible strategies in fulfilling the needs of an organisation and related contractors. Allowing BI to unify and reinforce data and management will ensure stable development and, ultimately, reduce precious costs. For example, when you take a closer look at the dashboard above, you can clearly see the structure of suppliers and how it affects the procurement function. Tracking relevant metrics such as the compliance rate, the number of suppliers, and the purchase order cycle time, among others, will benefit each employee looking to perform in the best way possible. This kind of overview, accompanied by real-time data, structured in clear visuals and interactivity that no static spreadsheet can offer, will have a positive impact on the performance, future negotiations, and strategies.
3. Sales
No company can get by in today’s market without a sales department that is often full of intricate processes and ever-changing strategies, whether short-term or longer. Tuning sales operations, CRM management, prospects, and performance monitoring into a single overview can be a tough challenge, even for experienced professionals. Often enough, data is scattered through various systems and the only way to connect them is through traditional spreadsheets. However, modern times require modern solutions, and BI steps into this demanding function and generates them for each sales professional involved. A professional sales dashboard is one of the building blocks of such solutions:
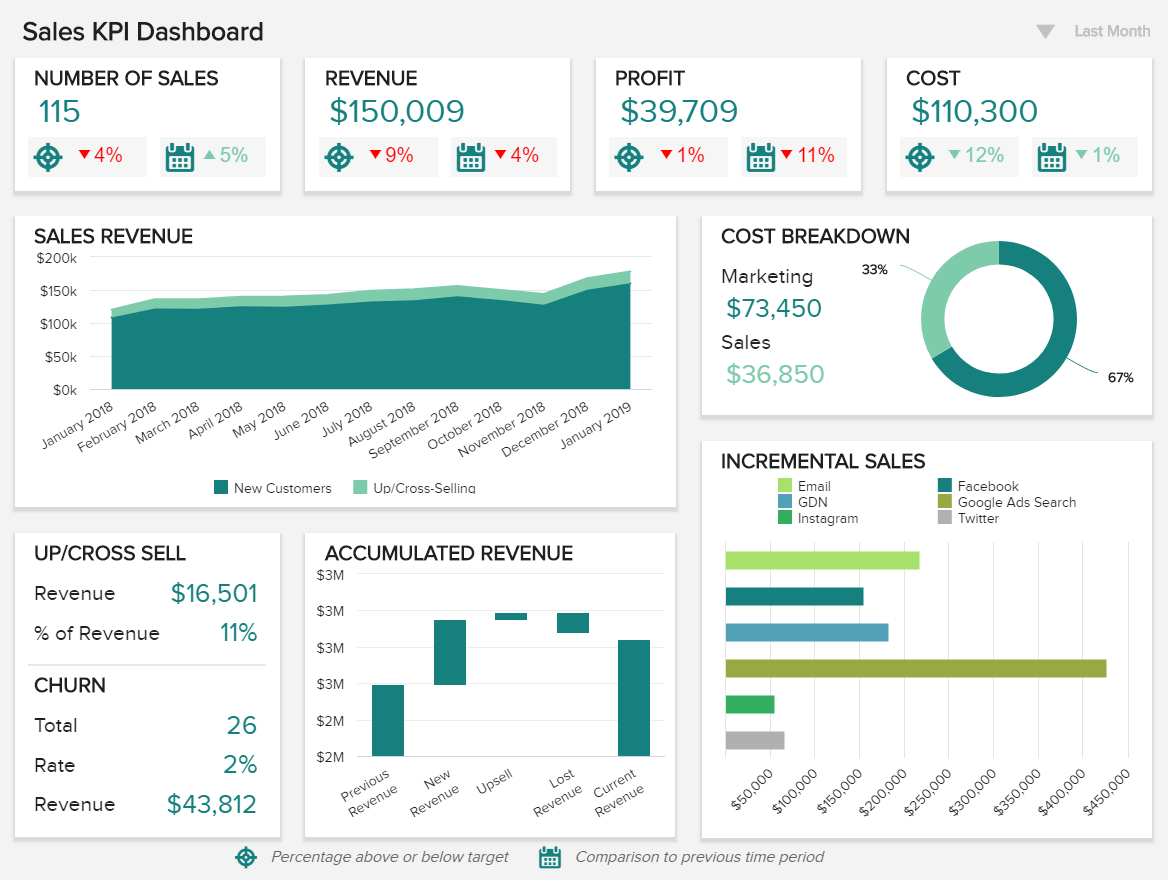
Having all-encompassing metrics in an interactive overview creates a focus on the most relevant data for the specific sales scenario. Our template above has unified KPIs that matter to C-level executives and VPs the most. High-level metrics such as revenue, upsell and cross-sell rates, incremental sales and cost breakdown provide a birds-eye overview of the high-level strategies defined in a sales department. By connecting needed data sources, the sales pipeline can work much more effectively, bringing fresh revenue as a result. Visualising the development of the department, each executive can dig deeper to see which metric didn’t perform well in the past, refresh the data in real-time and act before serious bottlenecks occur.
4. Marketing
Marketing is an important part of every company, no matter if it’s done in-house or from an agency point of view. Promotional activities need to be constantly updated, numerous reports sent on a regular basis and strategic initiatives discussed in a clear and detailed way. That way, the company knows what to expect from the marketing department, the agency can respect tight deadlines, and professionals can save numerous hours. Lots of invaluable information can be gathered on a simple, yet comprehensive and detailed marketing dashboard such as the one below:
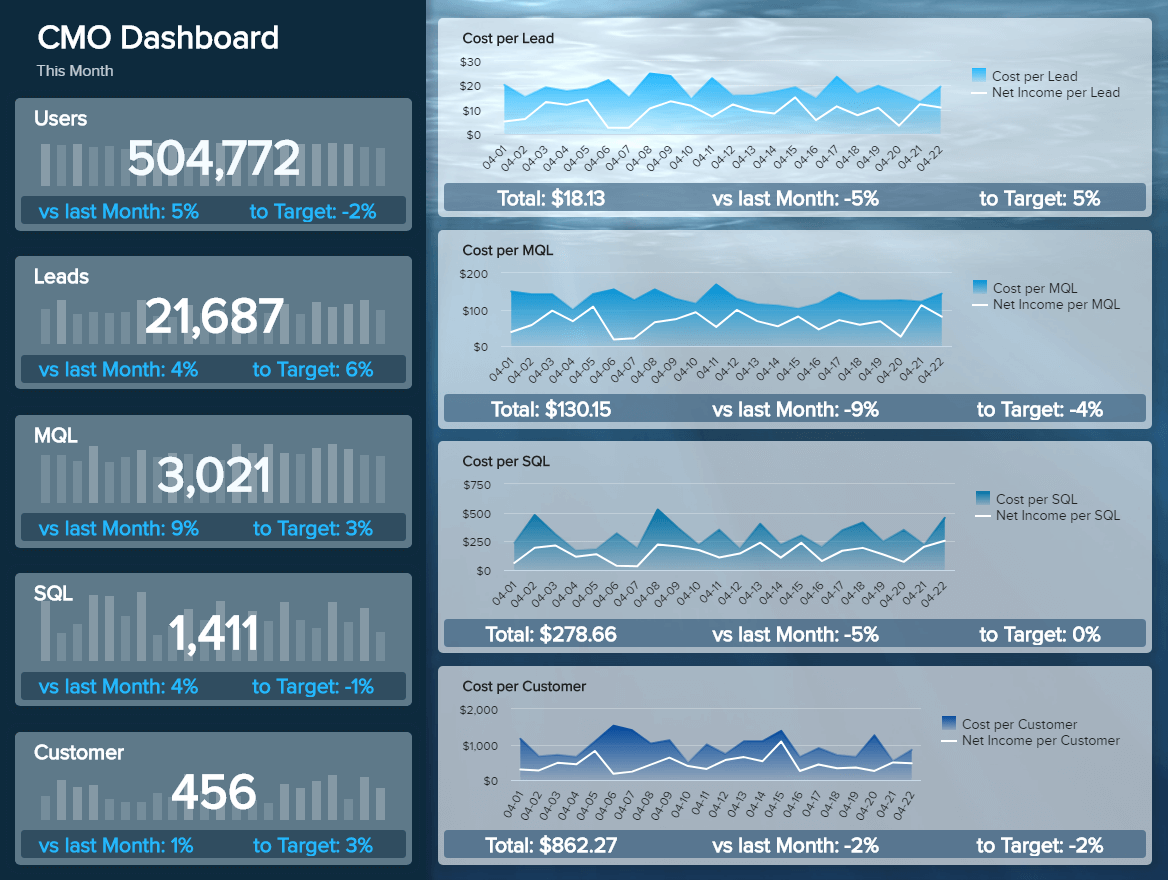
The example above is built based on relevant CMO’s metrics that companies usually discuss during the strategic planning of marketing initiatives. It’s often the case that enormous volumes of data are simply not manageable through traditional means of reporting or data presentations. That’s why this dashboard demonstrates high-level metrics such as the cost per lead, MQL, SQL, and net incomes of each, among other crucial metrics. They can easily tell you where your marketing department stands compared to the previous month and enable you to draw conclusions and possible adjustments. This dashboard can be fully automated so CMOs don’t need to spend hours compiling reports each time they have a meeting or want to analyse their marketing progress.
5. IT
As we mentioned something similar before, modern analytics require modern solutions. Whether you work as an IT project manager or focus more on technical issues, you need to have a hands-on overview of what happens in the department to be able to act swiftly and accurately. Juggling between numerous reports, and often being asked by other departments to create one (or dozens) can cause obstructions in the efficient workings of the IT department. Turning to a powerful IT dashboard will save precious resources and relieve the often overburdened IT department of many requests from other functions in a company:
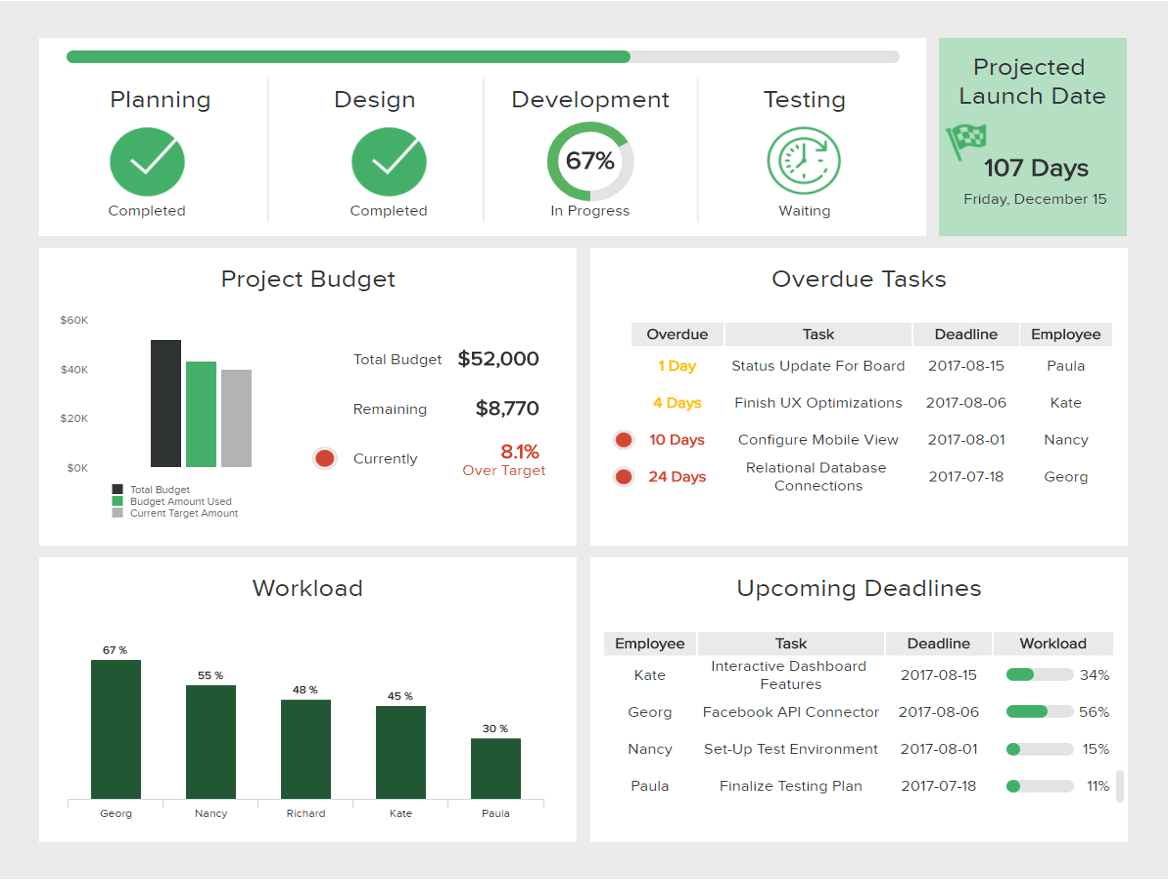
The focus of our dashboard above lies within the field of IT project management. By letting software monitor and alarm the user based on selected metrics thoroughly, each project can be delivered on time since potential obstacles can be spotted immediately. This solution for business intelligence in IT tracks every important step to deliver a successful project. By having a complete overview of the project budget, planning, development, workload, and tasks needed for obtaining favourable results, each manager can allocate their resources more effectively and make sure everyone on the team is on the same page.
6. Management
Managers today have to deal with a lot of responsibilities, no matter the industry or the area of work. For this reason, they need to be able to react fast and proactively to any changes regarding their employees, company projects, clients, or market behaviours. By using the best BI solutions, managers can easily monitor the day-to-day activity of the business and extract actionable insights to perform in different areas based on the most recent data. Let’s look at this in more detail with a management dashboard.
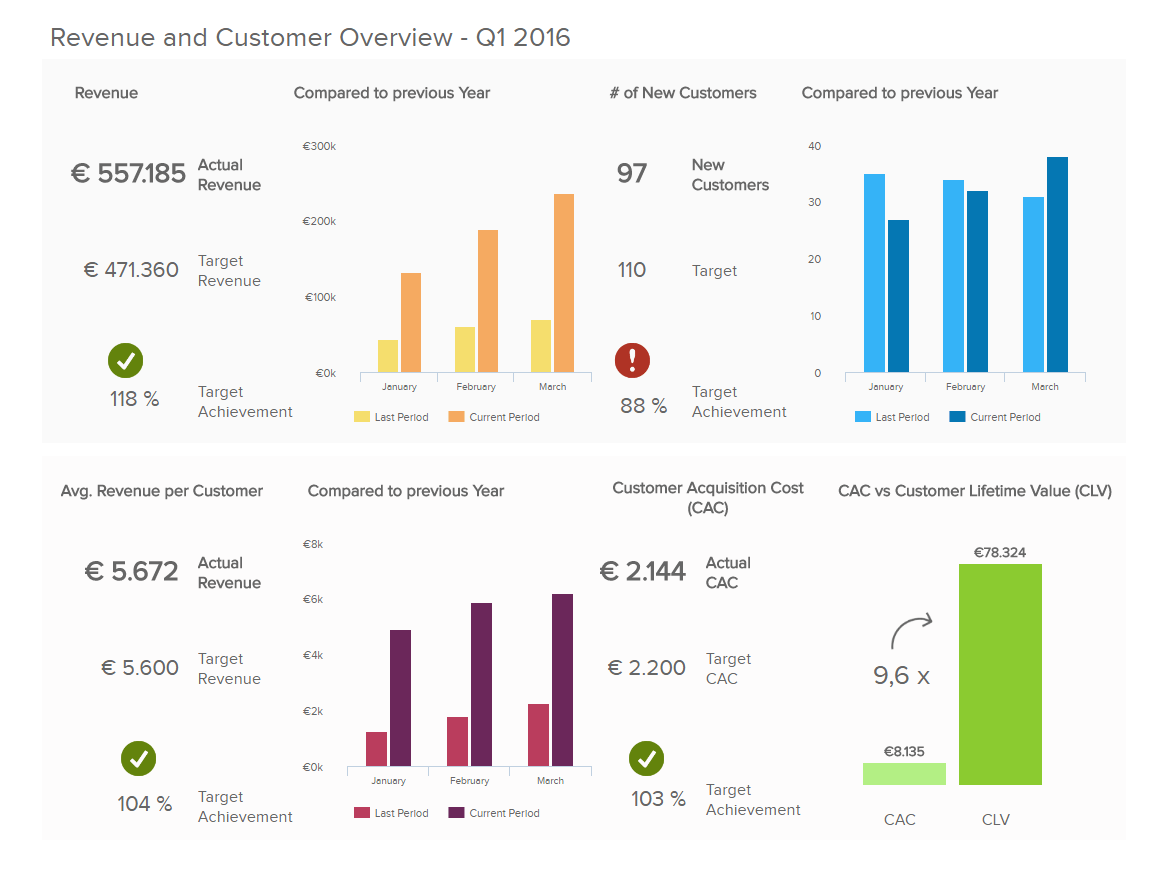
The management KPI dashboard above focuses on the total revenues as well as a customer overview. The first two charts display the actual number of revenues and clients along with a target number and its achievement percentage. Both metrics are paired with a bar chart that compares the previous period with the current one. In addition to these metrics, the template provides information regarding the total revenue and average revenue per customer, as well as statistics related to the number of new customers and customer acquisition cost (CAC). As we said before, by getting this complete overview, managers can control the performance of all areas of the company and find new opportunities for improvement. For example, the number of new customers has not reached the expected target. This means it’s worth taking a look into the strategies more in detail to see where the problem might be.
7. Customer Service
It is well known that customers are the ones who define whether a business will succeed. For this reason, assisting them with their problems is one of the most important stages of a customer’s journey with your company. A good support service can mean that the customer will come back and recommend your brand to others, but a bad service experience can damage not only your reputation but the financial health of your company. For this reason, implementing a business intelligence solution to optimise your customer service department can be extremely beneficial as it will help you perform detailed analysis on important aspects such as your service team performance, your call center metrics, and your customer behaviours, among others. Through this, you will be able to optimise all your support processes and provide outstanding customer experience that will make you stand out from the competition.
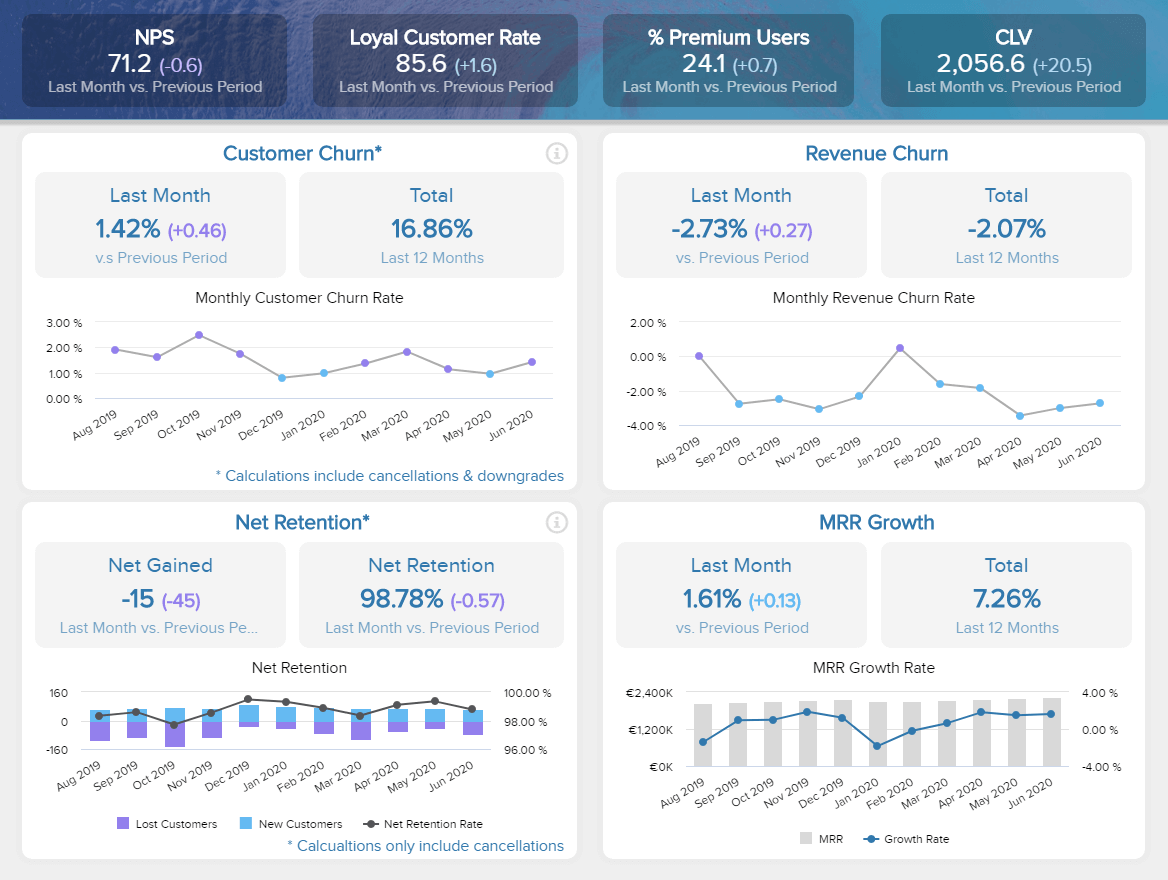
Acquiring new customers is way more expensive than retaining your current ones. This, paired with the fact that today’s consumers base their purchasing decisions on recommendations from other consumers, makes it fundamental for brands to work on their customer base and make sure that they are happy with the business. For this purpose, we present you with a customer retention dashboard displaying relevant retention metrics. On top of the customer service dashboard example, you can see a clear overview of the NPS, loyal customer rate, the percentage of premium users, and the CLV, all based on a comparison with the previous period. Then we see four charts tracking the monthly performance of the customer churn, the revenue churn, the net retention, and the MRR growth. All of them are paired with a trend chart of one-year performance based on a target, this way you can understand how these metrics fluctuated over time and identify improvement opportunities.
8. Finance
Last but not least in our list of BI solutions by function is finances. Arguably the most important function in any business, especially considering that the financial health of a company is what will define its long-term success. Business intelligence solutions enable finance experts, as well as managers from other areas that might need to work with the data, to extract insights that will lead to increased productivity and to the optimisation of processes such as budgeting or financial statements. All this results in a stable financial environment.

To put the benefits of BI solutions into perspective we present a complete financial dashboard that provides an easy-to-understand overview of the income statement from revenue to net profit. On the top, we can see the four main metrics in which this dashboard centers: gross profit margin, OPEX ratio (which is displayed more in detail later in the dashboard), operating profit margin, and net profit margin. Next, we see a chart breaking down the income statement of this company with the subcomponents of each of the four metrics on the top. Turning raw numbers into simple, yet effective visuals that will tell a comprehensive data story will not only enable financial professionals to translate their work to anyone that needs to handle financial data, but also help everyone included to save numerous hours and set a healthy foundation to upscale analysis processes.
4) What Industries Use Business Intelligence? Explore Professional Industry BI Solutions
After providing examples from various business functions, it’s time to take a look at the application of BI in different industries. Monitoring real-time analytics, utilising powerful features and predicting the future is no longer a task of a designated data scientist but of an average business user as well. Here we will cover how BI can be applied in various industries and present a business intelligence solutions case study for each.
1. Logistics
Logistics is one of the most complex industries that require constant data updates, accurate supply chain tracking, and management of large-scale datasets that, often enough, need urgent attention. To ensure all the bits and pieces of the logistics sector function properly, you can utilise a logistics dashboard to track all your data to derive insights within minutes. These dashboards, created with a powerful, yet simple, BI solution, will enable you to transform all your operations into more effective ones, and ensure development across the board:
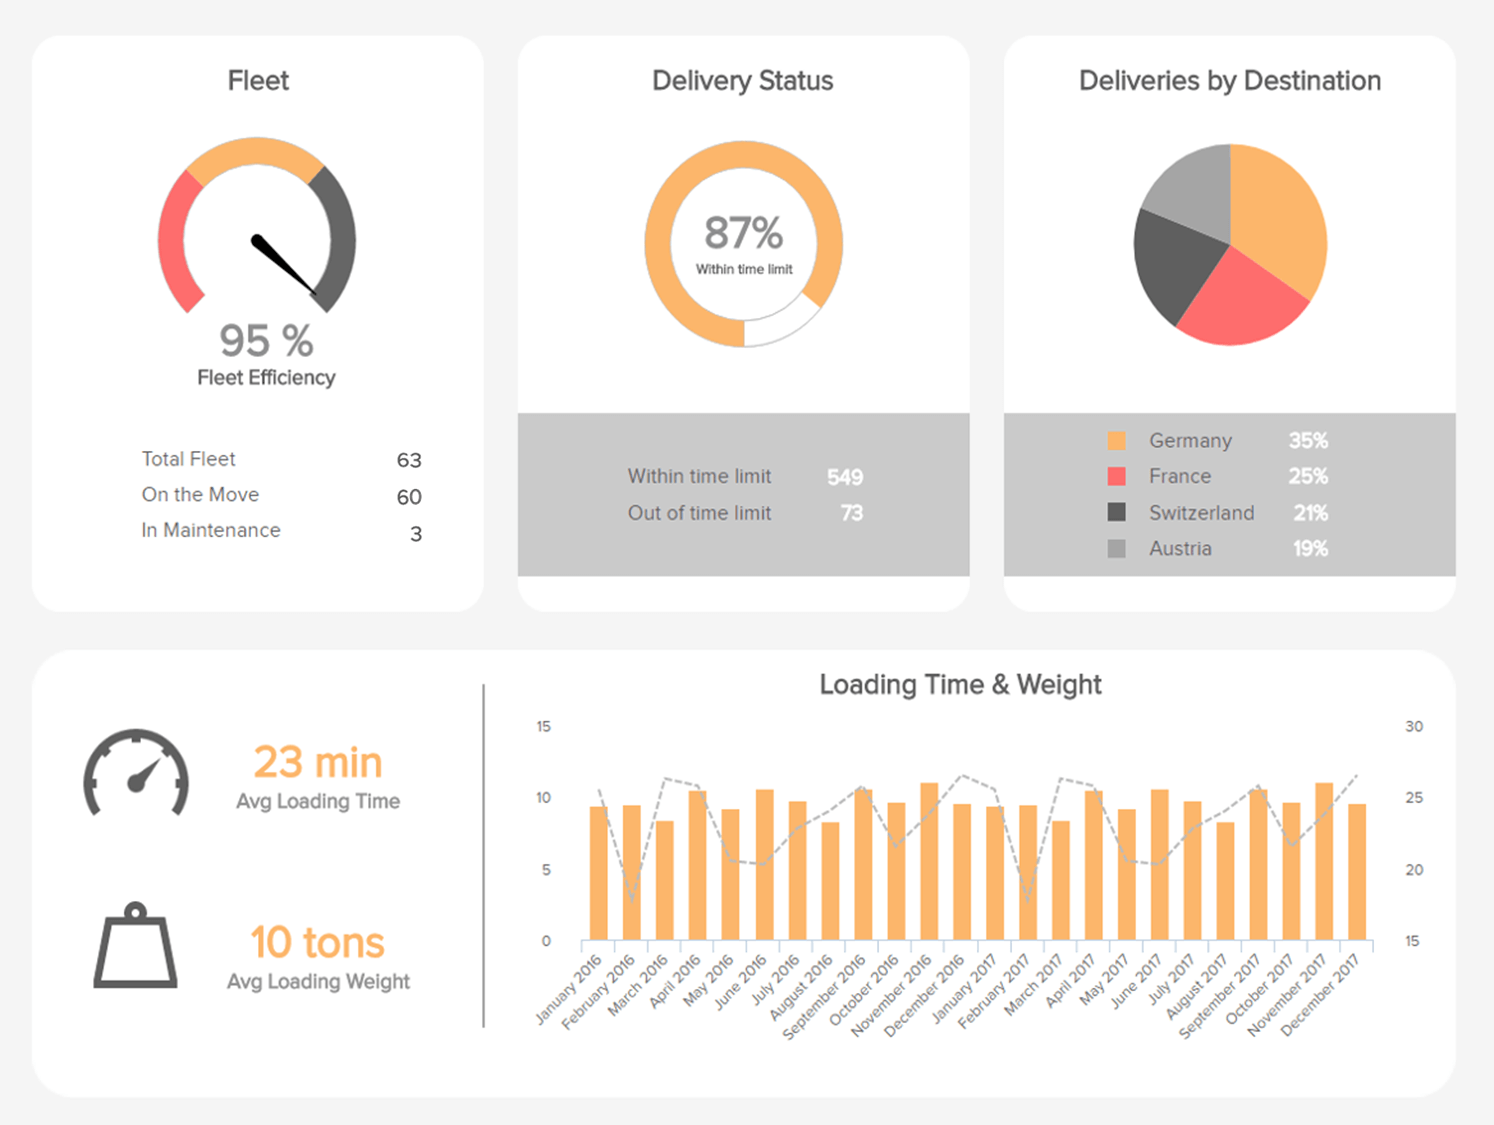
Our example above is focused on transportation management in the logistics industry. Informing the right person at the right time about your shipping flows and ensuring better operational and strategic performance. We can clearly see the main metrics spread across our business intelligence analytics dashboard solution for managing the fleet, deliveries, loading time and weight. Visualised in interactive charts, these core metrics, will minimise the possibilities for errors, keeping the dashboard updated in real-time, sharing with colleagues or stakeholders, automating many processes that were performed manually in this cutthroat industry. By utilising a BI platform for managing all the elements of the logistics processes, productivity is well increased, complexities simplified, errors minimised, and full control of the organisation is established with just a few clicks.
2. Financial services
Revolving around numbers, the financial industry is certainly one of the most important for the economy of the world. There is no company that doesn’t need proper financial services and business intelligence enters the stage as the backbone of this rewarding but demanding industry. Everyone in the financial sector has the same goal – to make better financial decisions and capitalise on the company’s analytics. But to be able to do so, financial managers need to look outside the box. Static spreadsheets won’t give you the speed needed to increase productivity, nor will they give you access to real-time information or automated calculations.
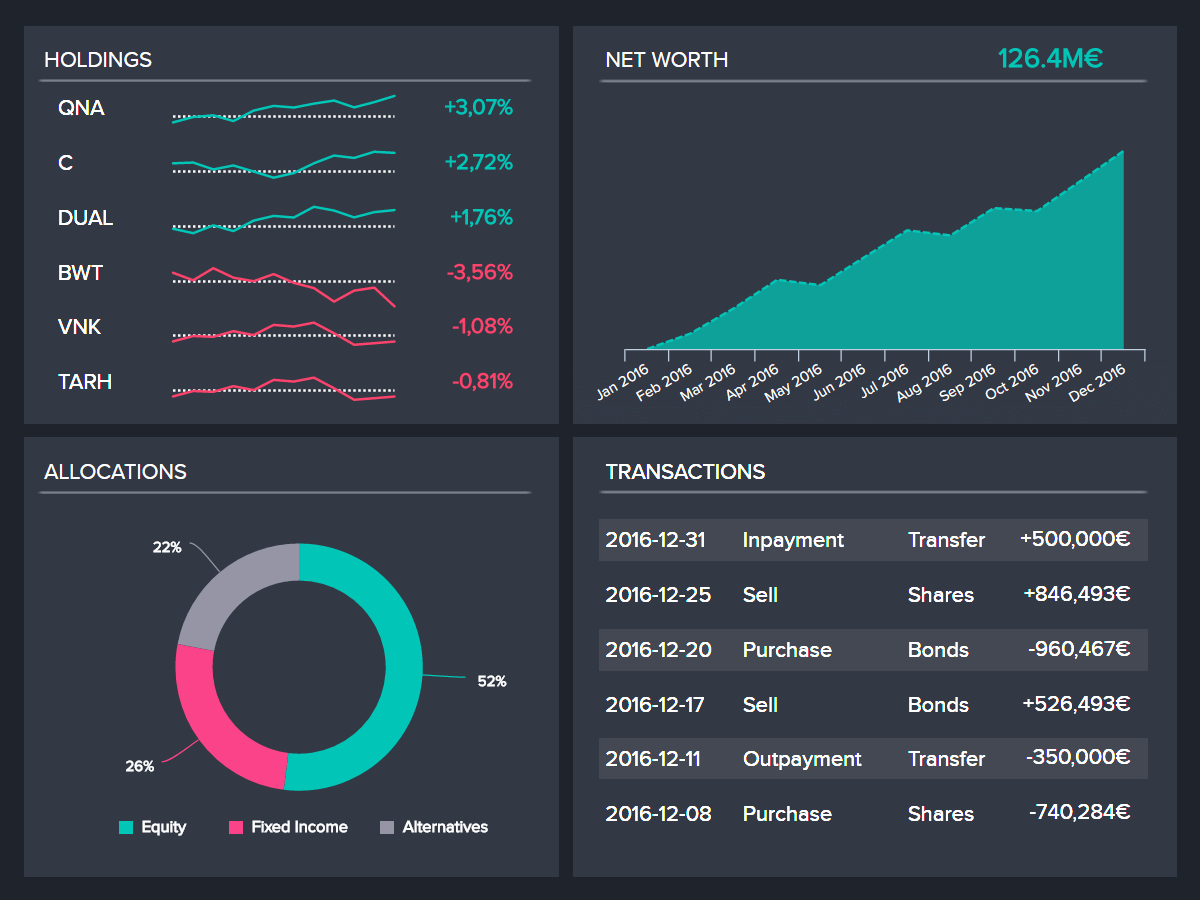
A financial report, as we present above, has many answers to the ever-changing financial data management. This portfolio management dashboard gives an overview of the performance of your finances by showing metrics like the net worth for the entire year, the allocations divided by sectors and regions, as well as an overview of the performance of your holdings with its historic net flows. This allows you to perform detailed analysis to produce an informed strategy, find new investment opportunities, or spot any gaps that need fixing. Through this, you can optimise cash flows, control expenses, and increase revenues which leads to enhanced enterprise planning and resource allocation.
3. Healthcare
The massive healthcare industry is not an exception when it comes to collecting enormous volumes of data. Each healthcare professional dealing with analytical data to improve the performance of the facility needs a sharp eye, agility in their data management approach and the help of modern software. Turning to healthcare BI solutions will not only decrease patients’ waiting times, but optimise the quality of healthcare services across the facility. Scattered data between numerous departments can be easily consolidated into a unified healthcare dashboard, focused on important metrics crucial for optimal performance:
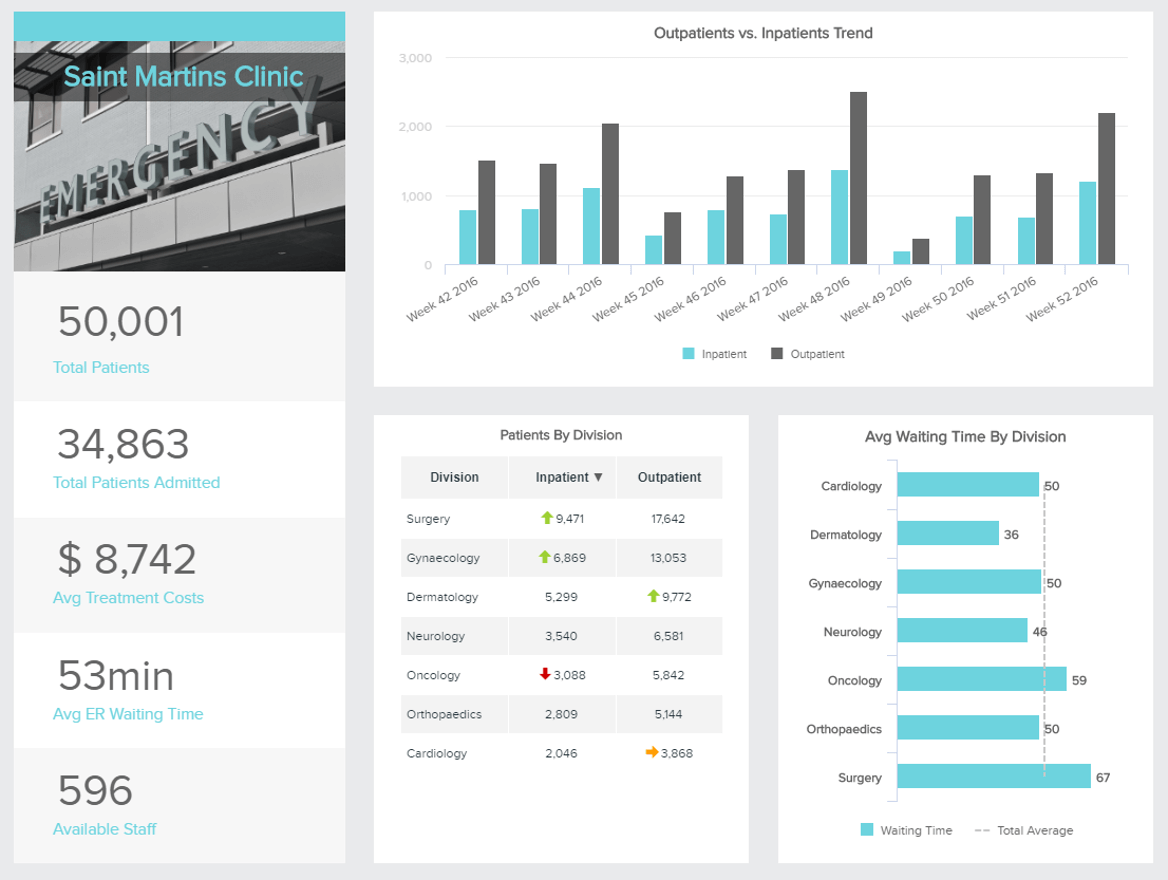
Our dashboard example above focuses on general hospital metrics such as the total number of patients, treatment costs, waiting time, and patients by division, among others. To successfully perform in this invaluable industry, a hospital manager must collect information that will enable him/her to optimise the operational and strategic activities of the facility at hand. Using BI to monitor performance, expenses, patient satisfaction and insights into the big picture of the hospital, will not only enhance the decision-making processes but prove to be an indispensable tool to form a healthy environment where health is needed the most. Clinical data doesn’t need to stay obsolete; evaluation of collected information doesn’t need to take a lot of time – with industry business intelligence, all important aspects of optimal hospital performance and high-quality treatments are covered.
4. Retail
Retail is an ever-changing industry that heavily relies on data to manage performance. Every retailer has the same goal: to increase sales and, ultimately, profits in order to stay competitive in this highly cutthroat environment. Modern business intelligence provides the right foundation to help retailers in their data management processes, ensuring updated information at any time so professionals can make fast but reliable and correct decisions. Business intelligence takes care of automation, visualisation and analytics of your operations so you can have a clear visual representation of what’s going on and where. Hence, you can focus on why and optimise your operations. A retail dashboard can fully support you in the process:

Focused on the most prominent retail store metrics such as sales by division and city, out of stock items and top 5 articles sold, you can easily adapt your retail management and ensure your customers have the best possible offers at all times. By having an overview of such important metrics, you can easily avoid getting out of stock, affecting your customer relations, and overall efficiency. BI retail solutions will ensure your processes stay optimised and perform in the most effective way possible.
5. Manufacturing
Our business intelligence by industry rundown wouldn’t be complete without the manufacturing industry. Missing one essential piece of information during a specific production stage can mean serious damage to the manufacturing company, where robust decision-making is a key element to successfully performing and outperforming business goals and objectives. Furthermore, many different parts need to work together perfectly to establish the best possible performance of the manufacturing sector, and BI can act as the prime source for structure and reliable solution to merge all relevant processes and eliminate any possible error. Through a manufacturing dashboard that consolidates important data through real-time analytics, has features such as immense interactivity and can predict what will happen in the future, manufacturing processes can easily be optimised and improved:
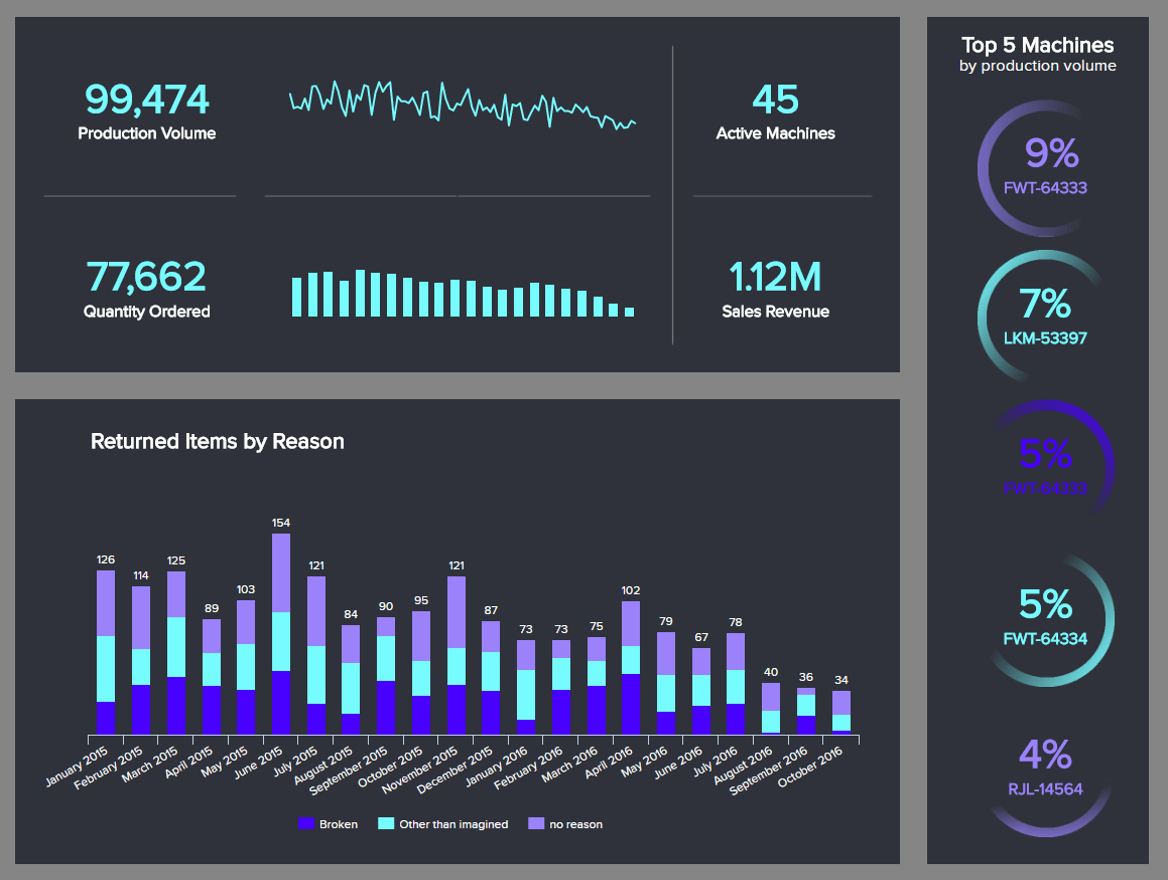
Products are the heart of any manufacturing company. Automating the monitoring of data completely eliminates manual analysis and calculations that can cause serious errors and affect the whole production process. Knowing the exact production volume, the quantity ordered, and the active and top-performing machines helps identify potential bottlenecks, and BI makes the analysis much easier and more effective. If you dig deeper into the reasons for returned items, you can set a clear strategy on what works best and how to avoid issues in the future. Industrial business intelligence doesn’t need to be complicated. With the right tools, organisations can make the most out of data, equipment, people, and business as a whole.
6. Digital Media
With the massive digitalisation of content and the increase in mobile device usage in the last decades, the media industry has been forced to adapt to new challenges like the demand for free, online, and immediate content that was then covered in the papers or the news. But along with these challenges, the digital era has also presented an opportunity. Thanks to BI and analytics solutions, media companies can access detailed information about their audience’s behaviours and preferences like they never could before. By performing detailed analysis of all the data in hand, they can improve decision-making processes, assess the audience’s feedback more accurately, evaluate any type of content they produce, and stay on top of all trends in the market.
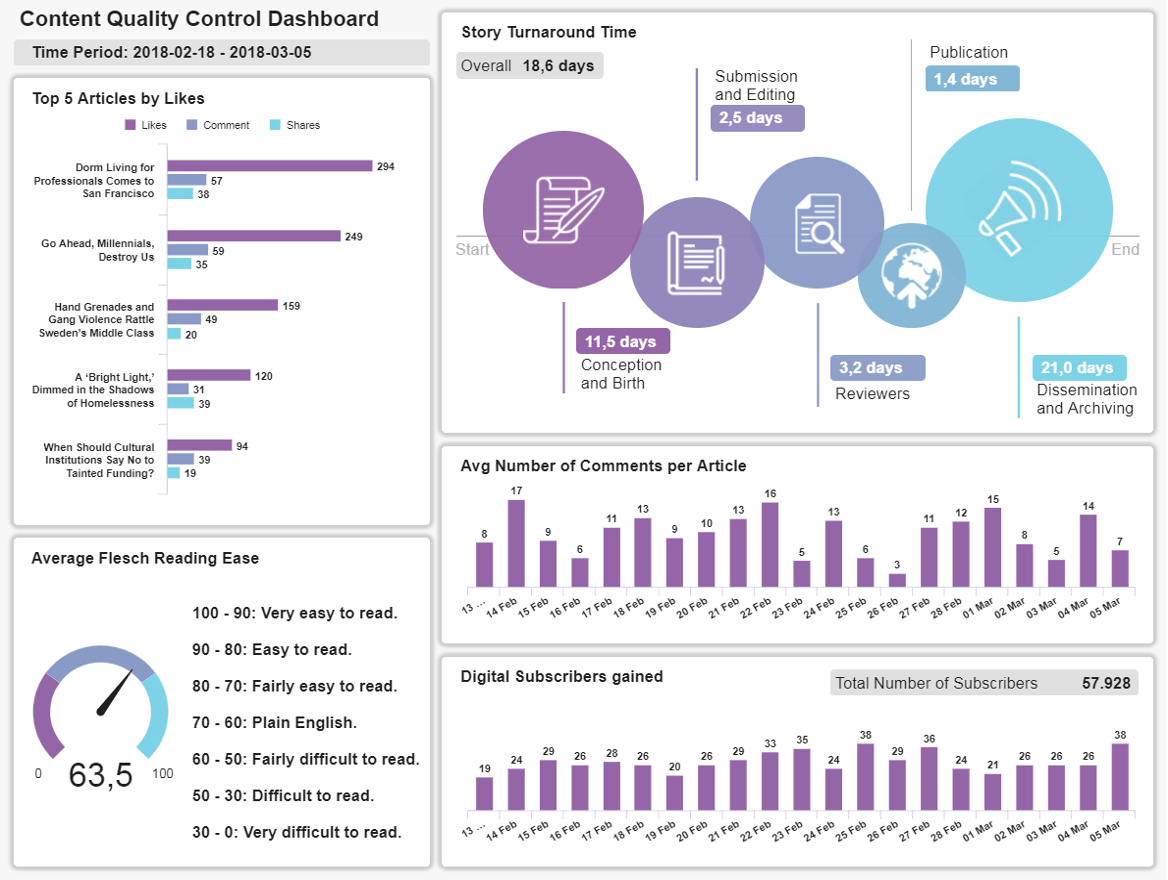
The above image is a digital media dashboard including relevant metrics to track content quality control. Starting with the stay turnaround time that gives you an overview of each stage of the publication process, beginning in the writing stage and finishing with publication. By tracking this metric, you can fully control how every piece of content is going and find any bottlenecks that might be slowing down the process. For example, if an article is stuck in editing for more time than expected, you may be producing too much content for only one editor to check. In addition, the dashboard includes KPIs to measure the success of your publications. For example, the top 5 articles by likes, the average number of comments per article, and the subscribers gained. Like this, you can understand what type of content your audience engages the most with and optimise your production accordingly.
7. FMCG (Fast-moving consumer goods)
The fast-moving consumer goods is another industry that has not been left unharmed with the advances of modern times. With more and more competition popping up every day, including big retailers and small sustainable businesses, FMCG companies have struggled to fight for brand awareness and to gain a place in new growing channels such as the e-commerce market. With such high competition, implementing business intelligence solutions can help FMCG managers to save money on inventory and supply costs as well as visualise patterns of consumers purchasing behaviours to give the best experience and products in this crowded market.
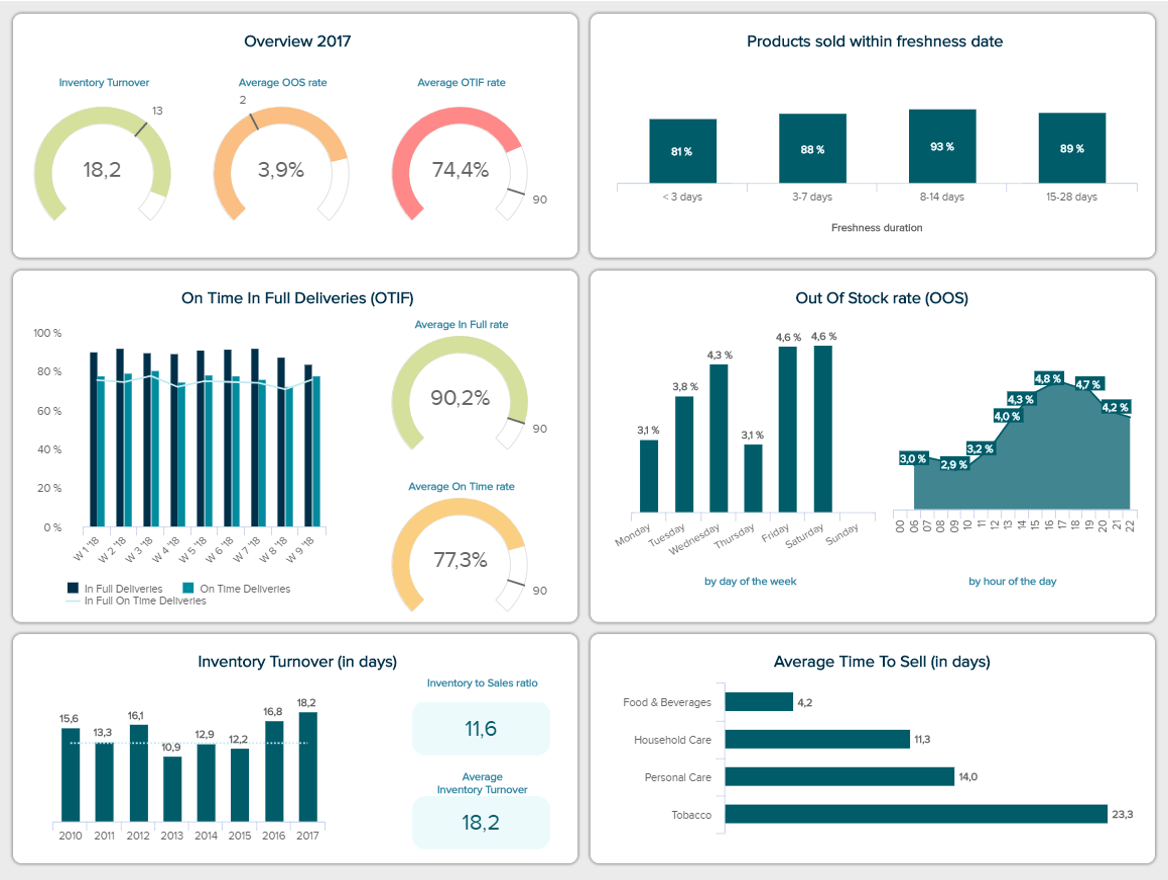
As we said, optimising your supply chain costs is one of the prime benefits of using business intelligence services for the fast-moving consumer goods industry and this FMCG dashboard proves it. First, we see an overview of the inventory turnover, the average OOS rate, and the average OTIF rate based on a pre-set target. By looking at these you can easily understand if something is not reaching the expected target and fix any problems in time. Next, we see these three metrics more in detail, where each is compared with other numbers that help drive more advanced conclusions about its performance. Finally, we see two KPIs that are really important for any FCGM company: the average time to sell in days and the products sold within freshness date. These metrics are important because the sales cycle time for this industry is often ruled by expiration dates or sanitary rules, which means it needs to be monitored carefully and constantly.
8. Energy
Following our list of industries that can benefit from enterprise business intelligence solutions, we couldn’t leave out energy. There are many types of energies powering our everyday life. With such a massive and important industry, it is impossible to ignore the potential a good data management process could bring to an energy company. By using a BI solution, energy managers have the opportunity to supervise production costs, consumption, and distribution, track environmental issues, predict changes in the market, and many more metrics that will lead to better decision-making and long-term business success.
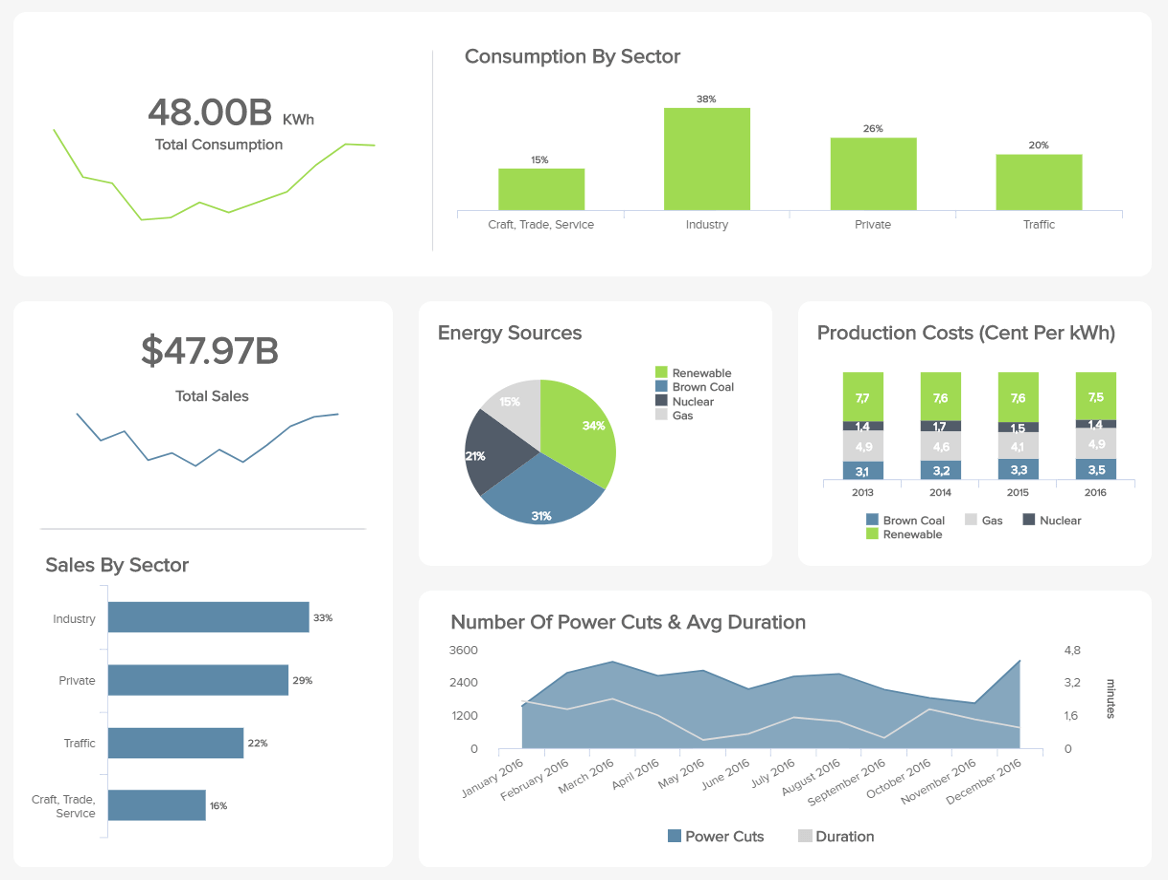
As we said before, energy companies are working in massive sectors powering the life of many people. For this reason, having a real-time overview of how everything is performing is important to keep the company running smoothly. The energy dashboard above displays an overview of the production of different plants. Starting with the sectors, you find metrics like consumption and sales, which allow you to understand which one is demanding more energy and prepare your production and delivery accordingly. In addition, the dashboard showcases two charts tracking energy sources and the production costs of each. This is a piece of valuable information to track, especially considering the environmental effects of energy production and the increasing demand for renewable energy. Finally, we see an operational chart tracking the downtime of your facility by calculating the number of power cuts and their duration.
9. Market Research
Data is the backbone of any market research agency. With so much survey and investigation data to handle, the analysis process can become tedious and time-consuming. With the help of business intelligence services, market research agencies can analyse user data in real-time and get actionable insights, identify patterns and trends in the data, make customer-focused decisions, and perform advanced analysis with the help of technologies such as artificial intelligence. Paired with all of this, it can also prove useful for external purposes, as it will add extra value that will lead to an increase in customer satisfaction and revenues. After detailed research on a topic comes the moment to present the results, and long PowerPoint presentations are not enough anymore. With the powerful interactive features of BI software, market analysts can make their whole presentation on one screen with the possibility to filter the data and use only the metrics necessary to support each discussion.
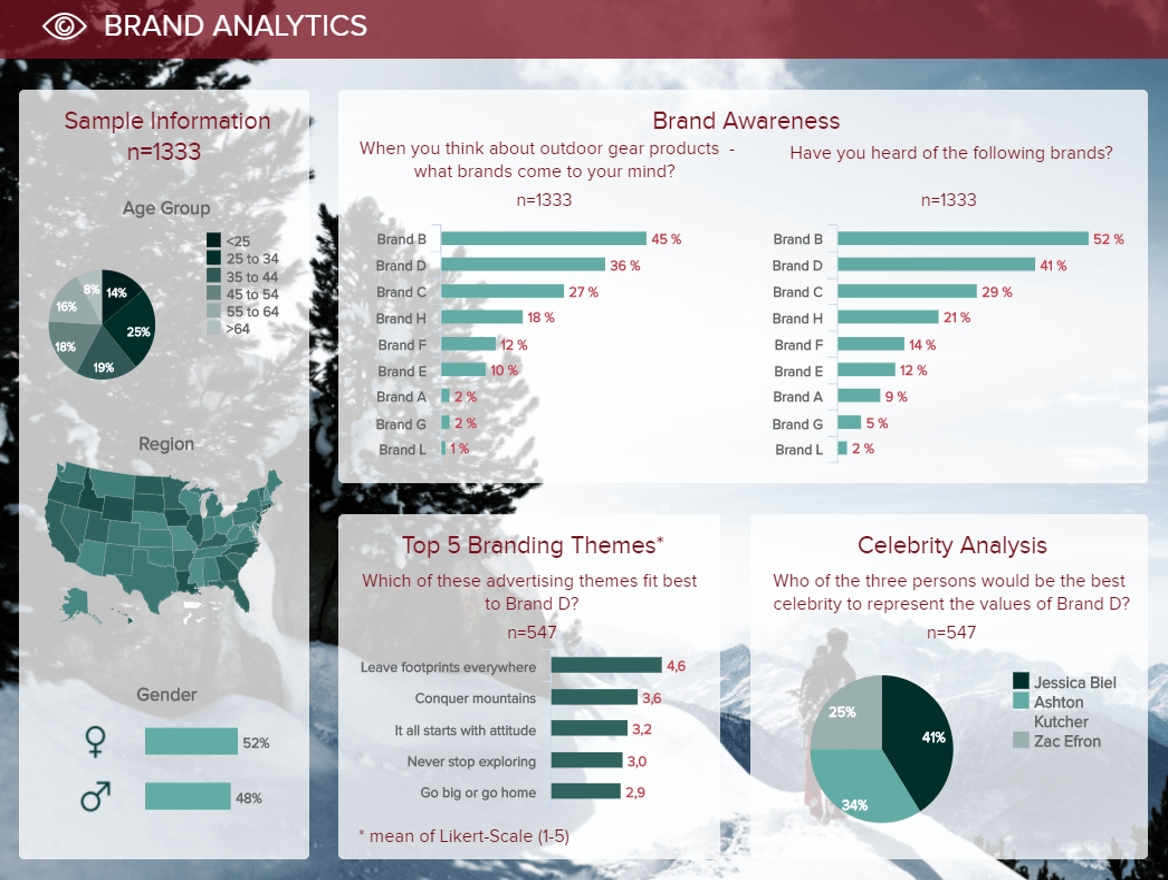
We’ve already mentioned the power of an interactive market research dashboard vs. traditional means of presentations. Let us see it in more detail now. The above dashboard displays the analysis of a specific brand in its market and the public perception based on varied factors. Starting from the left side, we can see the sample information divided into age group, region, and gender. Here you can also filter the data and compare results with each one of these metrics alone. Next, we see a brand awareness chart based on two questions and the number of times a particular brand was mentioned in the answers. This is then paired with particular information about the studied brand D like the top 5 branding themes and the celebrities that are paired with it. This type of visualisation tool allows you to see multiple questions at once and compare them with other stats to perform a complete and interactive discussion of the results.
10. Construction
It is known that construction companies have to deal with many touchpoints simultaneously, such as finances, corporate needs, work schedules and deadlines, suppliers, production, and many more. Making sure that everything runs smoothly and that all processes are done on time is not an easy task. For this reason, turning to a BI solution can be extremely beneficial for this type of industry. By correctly managing their data, construction companies can simplify their processes by connecting the data from all their touchpoints into one place. This way all those immense amounts of information can be turned into cost-efficient, sustainable, and actionable results.
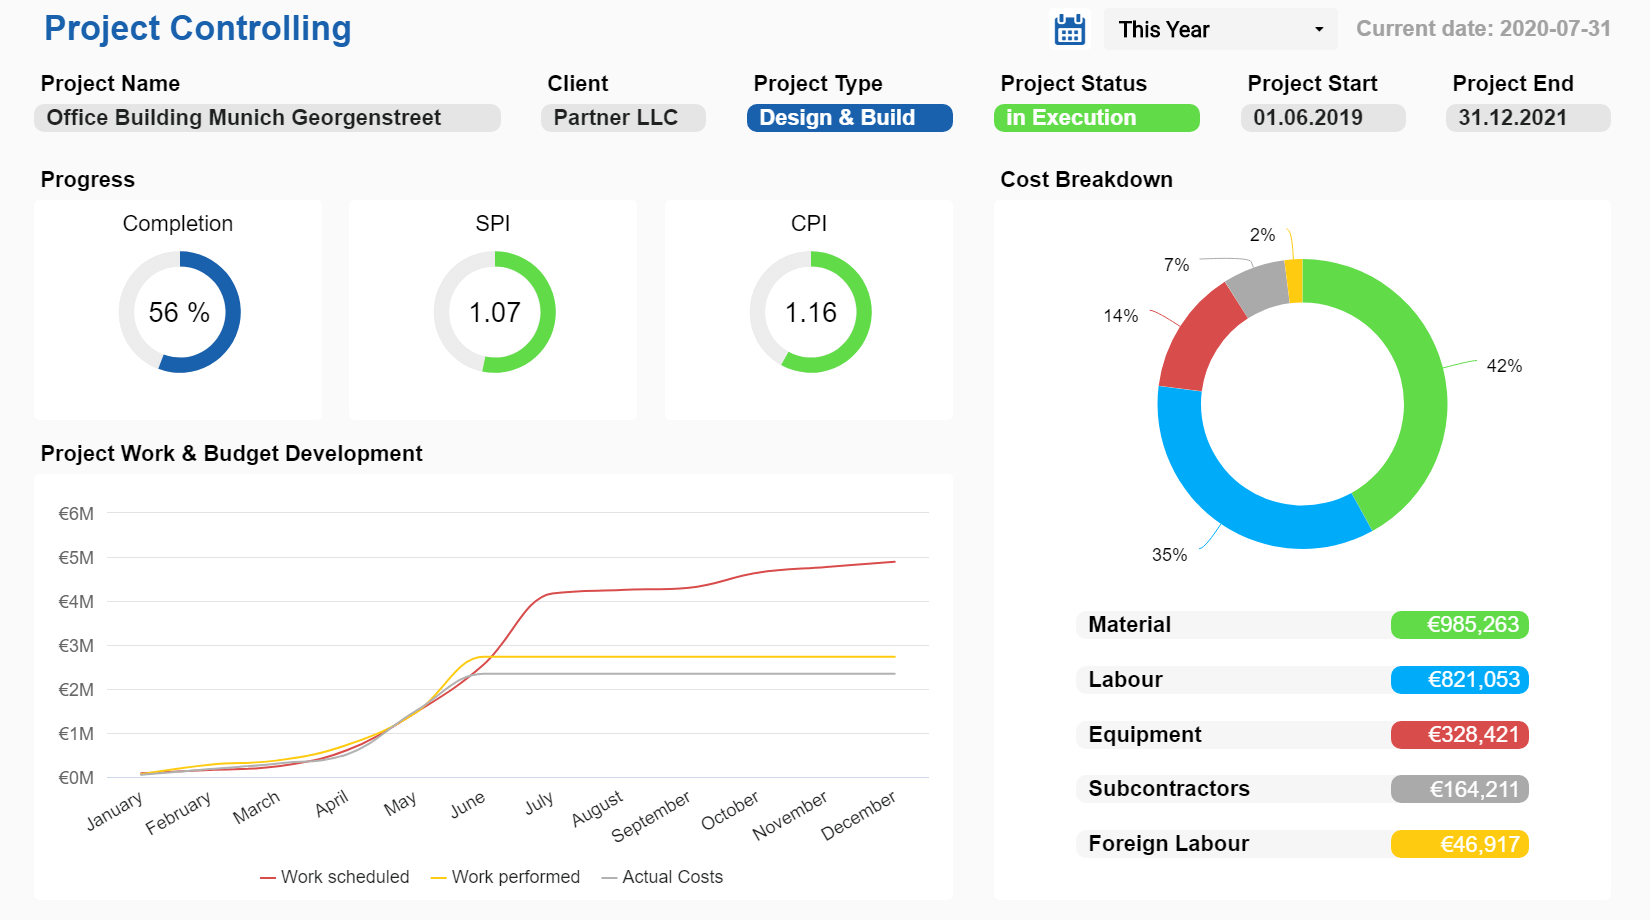
The construction analytics dashboard above perfectly illustrates all aspects that need to be covered for effective project management. On the top, we see general information about the project such as its name, the client, the type of project, the status, and its start and end date. Next, we see different metrics tracking the progress of the project such as the completion percentage, the SPI to measure how close the project is to being completed compared to the schedule, and the CPI to track the amount of completed work for every unit of cost spent. Finally, the dashboard offers a chart for cost breakdown divided by type of cost, and a line chart covering the project’s work & budget development based on the work scheduled and performed along with the actual costs. This dashboard will allow you to increase planning quality as well as optimise your budget development.
5) Best Practices To Implement A BI Solution
As you learned by now, business intelligence can boost performance and growth across departments and industries. Now, you might be wondering, how can I make this happen for my business? Well, a correct BI implementation requires you to follow some key best practices that will set the groundwork for success. Below, we list five of the most important ones.
1) Define your needs: There are many tools in the market to help organisations manage their analytical goals. So, to get started on the right foot and avoid investing in a tool that is either too much or too little for your business, it is of utmost importance to define general needs and expectations beforehand. For example, think about the current situation, what processes and tools you have in place (if any), your budget, and your main audience, among other things. With this knowledge in hand, you’ll be able to choose and implement a solution in the most productive and efficient way possible.
2) Set clear goals and targets: Expanding on the previous point, one of the crucial first steps you should follow to implement a BI tool successfully is to define clear targets and goals. These will help you guide your analytical efforts and manage expectations regarding BI implementation. In that sense, your goals should be short and long-term as well as realistic and achievable. Setting unrealistically ambitious goals can damage the morale of your workforce and cloud your analytical strategies.
3) Implement a data governance plan: As mentioned before, one of the key benefits of BI is accessibility across teams and departments. However, this level of accessibility requires certain rules and regulations to ensure the correct use of the data. That is what a governance plan does for you. It defines roles and responsibilities regarding who can access and manipulate the information to ensure your data strategy is carried out as planned but also to ensure sensitive data remains secure and private, which leads us to our next best practice.
4) Think of security and compliance: Investing a lot of money in a state-of-the-art solution will mean nothing if security is not a top priority. Organisations gather massive amounts of sensitive data in the shape of customer addresses, phone numbers, and credit card information, among other things. With the increasing number of cyberattacks, this data is at risk of being misused by criminals. This has led several governments across the world to implement privacy and security regulations that companies of all sizes need to attain to avoid huge financial penalties. And not just that, a breach of sensitive information can cause irreparable damage to the reputation of a business, so security and compliance should be a top priority.
5) Train your employees: This last best practice is equally or even more fundamental than the previous ones. Just like any other business-related process, implementing a BI solution requires all employees to be involved and qualified to use it. After all, they are the ones that will extract the maximum potential out of it. For that reason, after you’ve picked the tool you’ll invest in, you’ll need to assess the level of general analytical knowledge of your workforce and provide the necessary training. This means being able to understand and communicate with data and also use the specific functionalities of the chosen solution.
If you want to deepen your knowledge about BI and the steps you should follow to implement it in your organisation successfully, take a look at our BI roadmap blog post for a full dive into the topic.
6) Conclusion & Guidance
We have expounded on numerous benefits of business analytics solutions, provided you with industry and departmental examples that you can immediately implement into your own company and explained what each example brings to the table. We cannot stress more: by having modern BI implemented into your organisation, you can see results from day one, and immediately see how your time becomes stress-free. The possibility to focus on data through interactive visuals, schedule automated reports that will save you hours of work, and utilise modern artificial intelligence and predictive analytics will not only empower the technical team of your business, but each and every average business user that needs to create their own stories with the help of modern software and tools.
Save yourself from the bottlenecks of manual work, and try datapine for a 14-day trial, completely free. You can start your analysis, build your dashboards within minutes and interact with your data-story immediately. Our business intelligence solution will decrease your costs and increase productivity in no time. And don’t forget to schedule your reports so you can have updated information each week, month or whenever you might need it.
Build your own business intelligence dashboards within minutes!